
Use of a PC-Based Digitzer in a Medical Acoustic Microscopy System
By Andrew Dawson, Ph. D-GaGe (a Vitrek brand)

Introduction
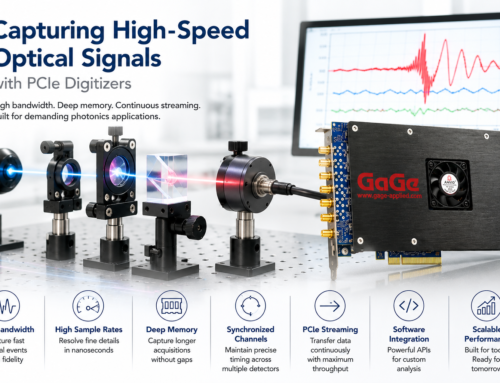
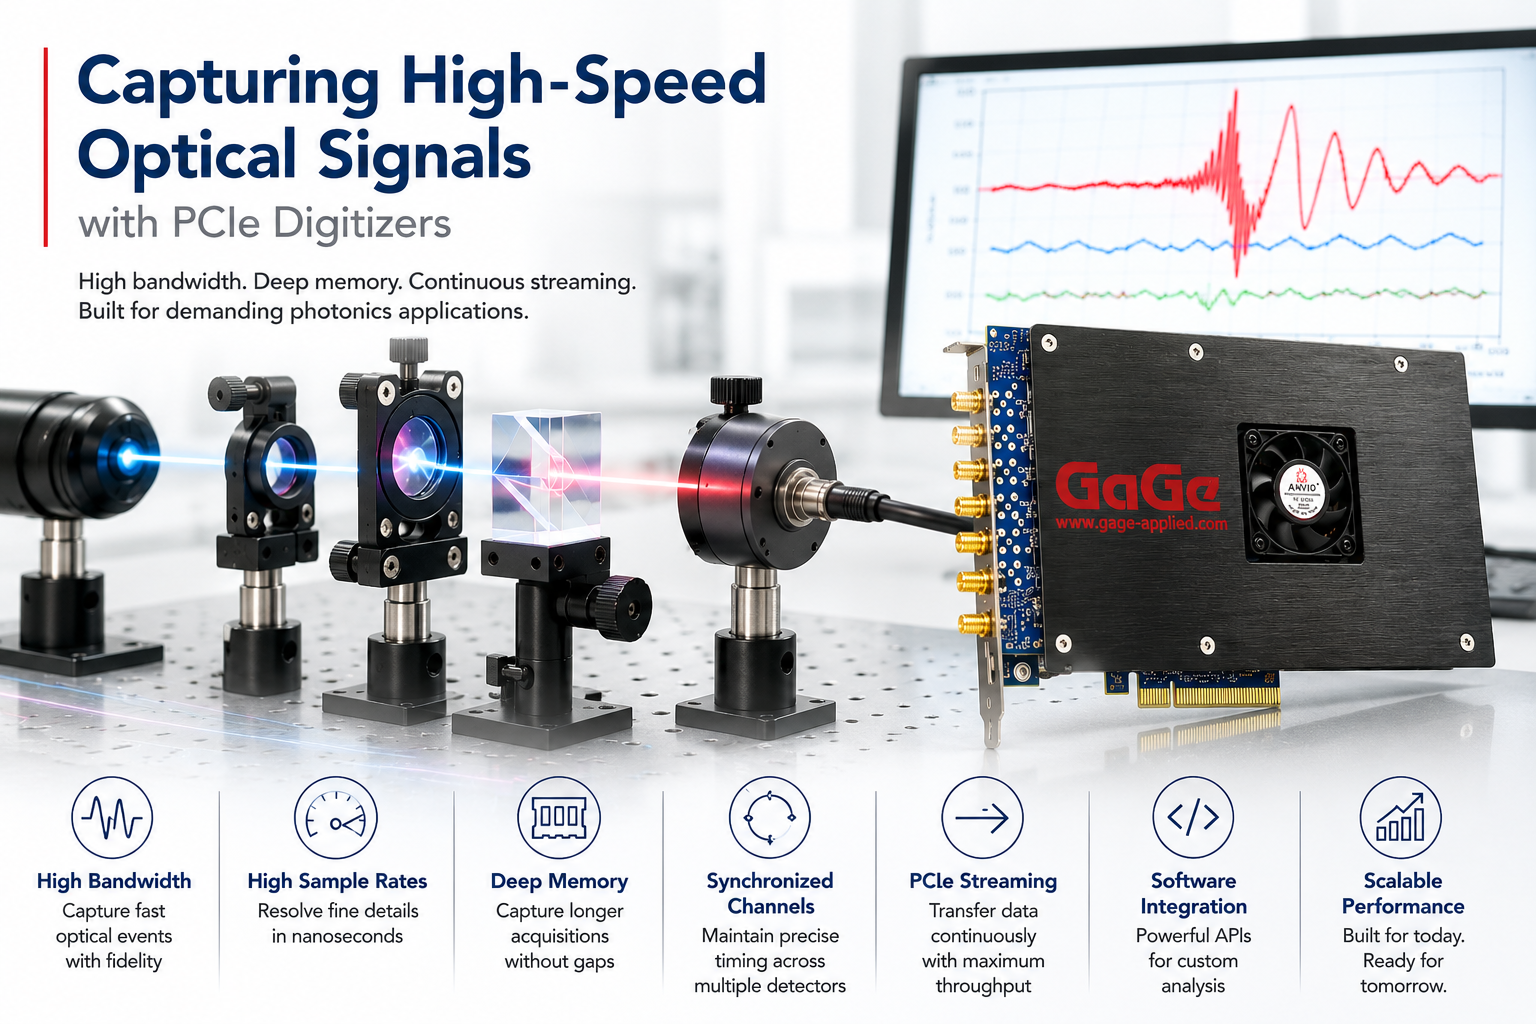
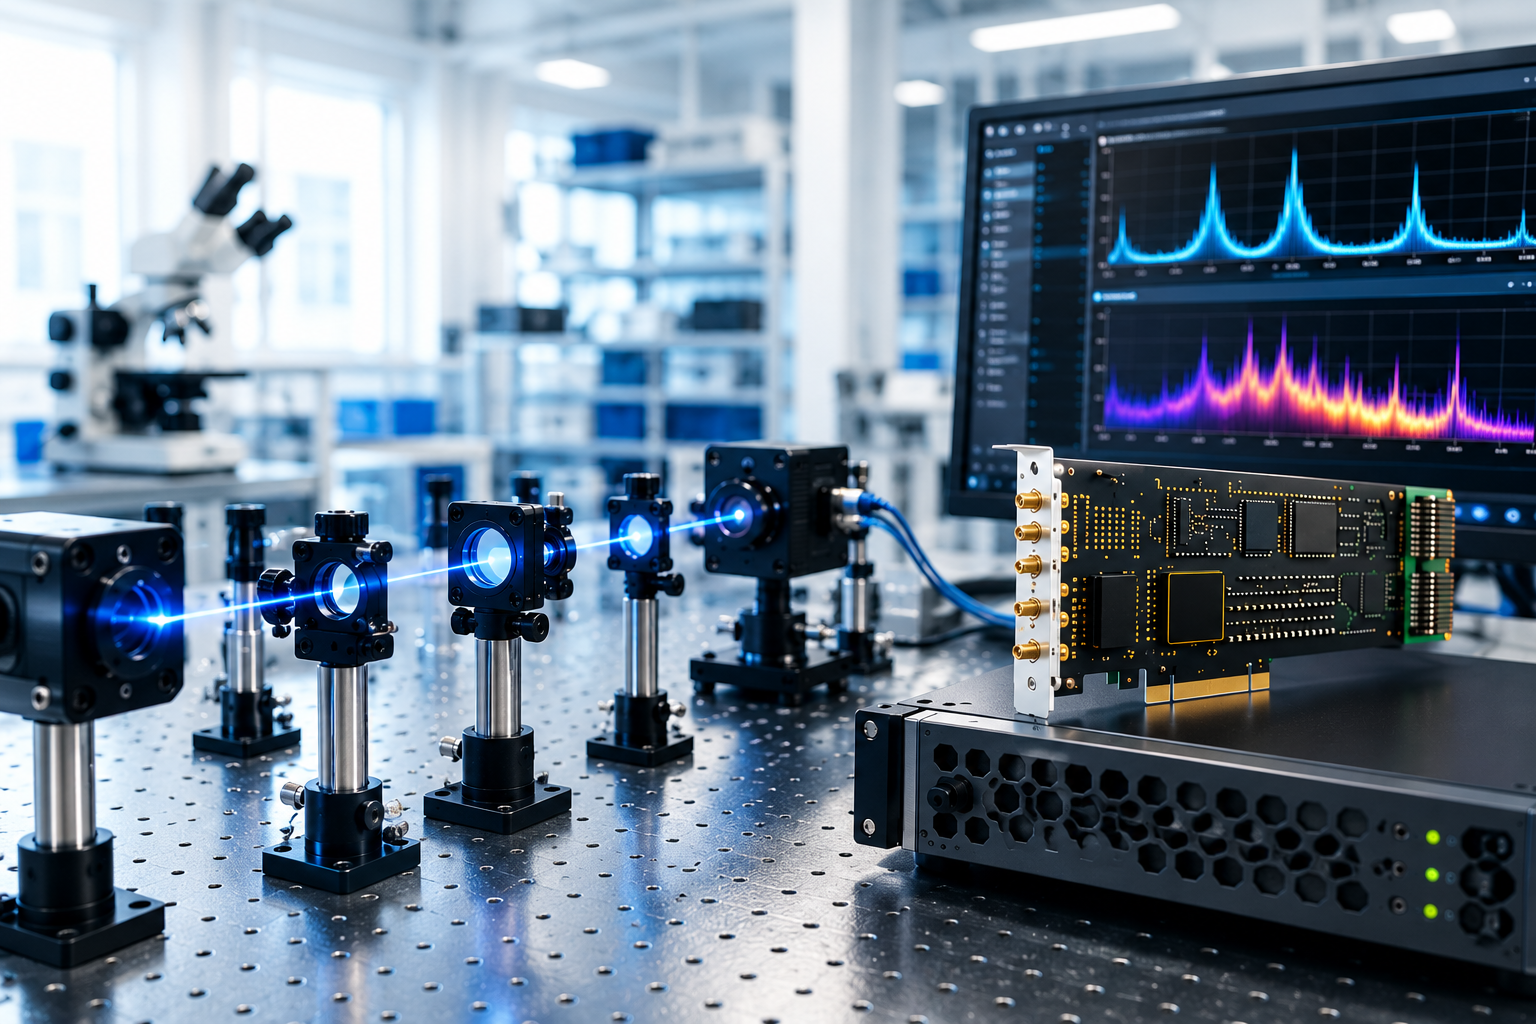
ABSTRACT: Construction of a medical acoustic microscopy system is discussed with focus upon usage of a PC-based high-performance GaGe RazorMax digitizer. Three main aspects of the RazorMax’s operation are addressed: usage of Dynamic Range Expansion (DRE) to maximize the detectability of small ultrasonic echoes, high-speed PCI Express Data Streaming for the fastest scanning speed and usage of GaGe’s Trigger Out signal for efficient and synchronous ultrasonic triggering.
Conventional ultrasonic imaging systems typically transmit broadband ultrasonic pulses through the full volume of the sample under study. Analysis of these pulses allows measurement of sample thickness and the presence of reflective flaws or interfaces between different materials in addition to enabling study of intrinsic material properties, such as elastic moduli [¹]. While providing the advantage of probing the entire volume of the sample, such imaging systems are typically limited to lower ultrasonic frequencies because of the sample’s severe ultrasonic attenuation, which increases rapidly with frequency. As an example, 10 MHz ultrasound will only travel a few millimeters in soft biological tissue before being severely attenuated. However, despite unwelcome increases in attenuation, the ultrasonic wavelength proportionately decreases with increasing frequency, which improves spatial resolution of the system in
consequence. Higher frequency ultrasonic systems, therefore, intrinsically provide superior spatial resolution.
Configuration
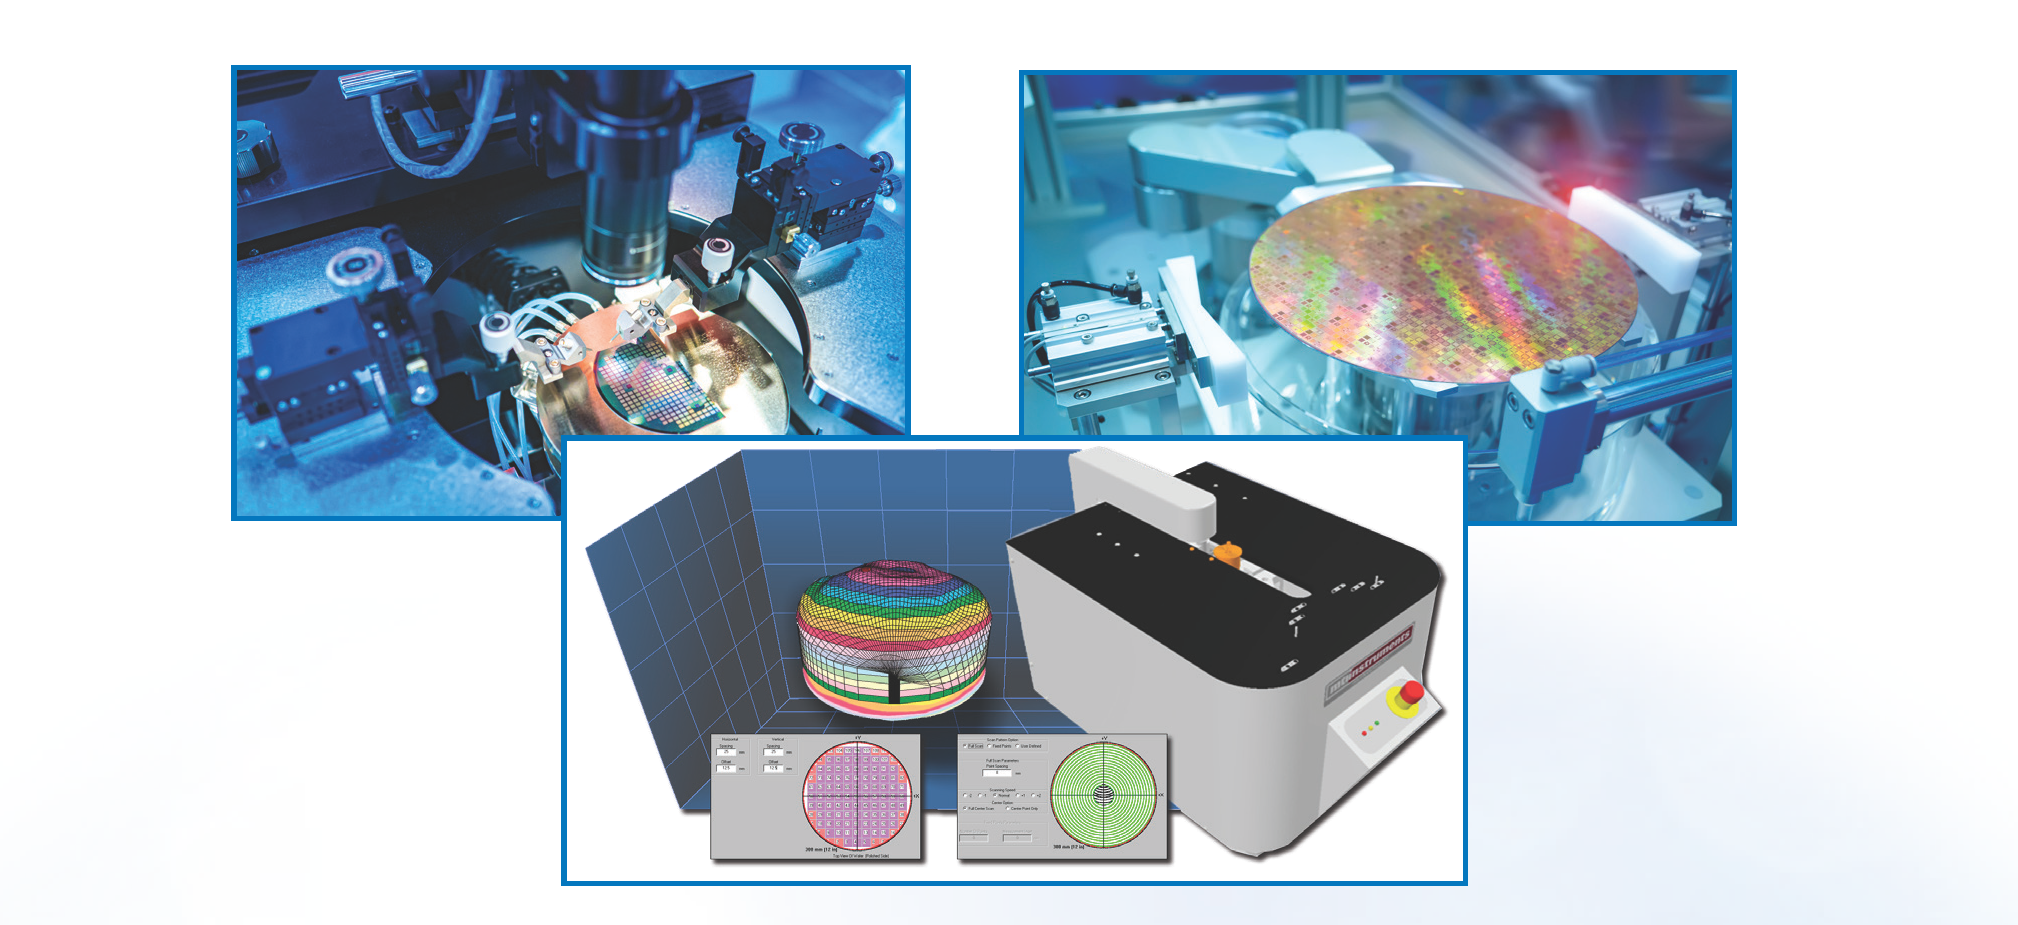
Higher frequency ultrasonic systems are often called acoustic microscopes, of which an example is shown in Figure 1. Acoustic microscopes typically use ultrasound from 35 MHz to 1 GHz and beyond. Because of high signal attenuation, the sample may only be probed within a few millimeters of its surface. Furthermore, to maximize signal intensity and spatial resolution, microscopy systems usually employ a focused transducer. The focused transducer is coupled to the sample through a droplet of ultrasonic couplant – often water – that is dragged along by the transducer as it is robotically positioned in a scan pattern across the sample surface.

Figure 1. Block Diagram of Scanning Acoustic Microscopy System. The red dot indicates the focal point of the transducer. Signal Out from the Pulser/Receiver is split in two by an RF splitter – one of whose outputs passes through a passive attenuator (ATTR) before entering the GaGe RazorMax digitizer.
The focal distance of the transducer defines a plane within the sample parallel to its surface that is scanned. The position of this plane may be varied slightly by moving the transducer normal to the surface. For larger changes, transducers with different focal distances may be used. Modern microscopy systems now employ segmented transducers whose focal depth may be rapidly varied by modifying the segment excitation pattern.
As in conventional ultrasonic imaging systems, microscopy systems excite a transducer with a broadband high-voltage excitation. Echoes reflected from scatterers within the sample are then detected with this same transducer. Figure 2 illustrates typical ultrasonic waveforms that show simple echoes from both the front wall of the sample and from a scatterer at the focal point of the transducer, indicated in Figure 1.
Scatterers consist of interfaces between materials of different acoustic impedance that reflect ultrasound – thus providing contrast for images. The depth of a scatterer is derived from the standard ultrasonic relation:

where v is the acoustic propagation speed through the sample medium and Δ t is the elapsed time between the two echoes. The factor of 2 accounts for the roundtrip taken by the ultrasonic pulse. Additional information is provided by the amplitude ratio A₂ /A₁, which decreases with attenuation by the media, as well as with scatterer depth, size, and contrast.

Figure 2: Two simulated ultrasonic signals sampled at 1 GS/s that each contain two reflected echoes pulses. The first echo is from the front sample surface and the second echo is from an embedded scatterer, which is shown in a magnified view within the green circle. Vertically separated for clarity, blue and red signals indicate unamplified and amplified signals, respectively, as described in the text. Conventional echo separation (Δt) and echo amplitudes (A₁ and A₂) are shown with dashed lines.
As discussed, acoustic microscopes can reveal internal sample interface structures by detecting echoes reflected from internal sample structures. Additionally, focused transducers may detect other ultrasonic echoes resulting from ultrasonic mode conversion, surface waves or from dispersed, non-abrupt structures. While understanding the nature and origin of all detected echoes is ideal, acoustic microscopes users may also operate phenomenologically by using ultrasonic contrast to unveil useful information about the sample interior without necessarily understanding its exact explanation.
A medical research customer wanted to construct an acoustic microscope to scan biological tissue samples using ultrasonic frequencies up to 250 MHz but will typically use a frequency of 70 MHz. The researcher needs a digitizer with high vertical resolution to detect small echoes and wishes to sample at up to 1 GigaSample per second (GS/s). Waveform lengths acquired by the digitizer must accommodate depths within the sample of up to 6 millimeters.
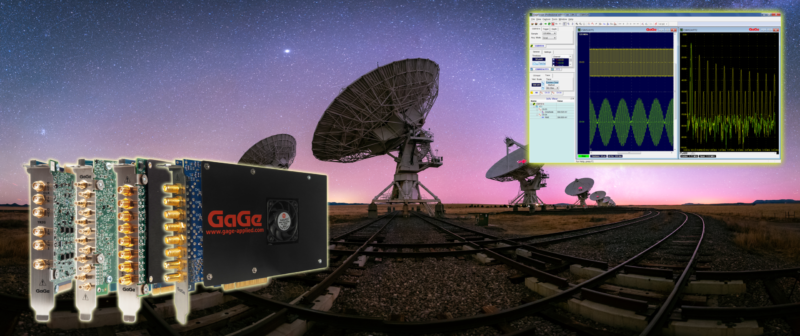
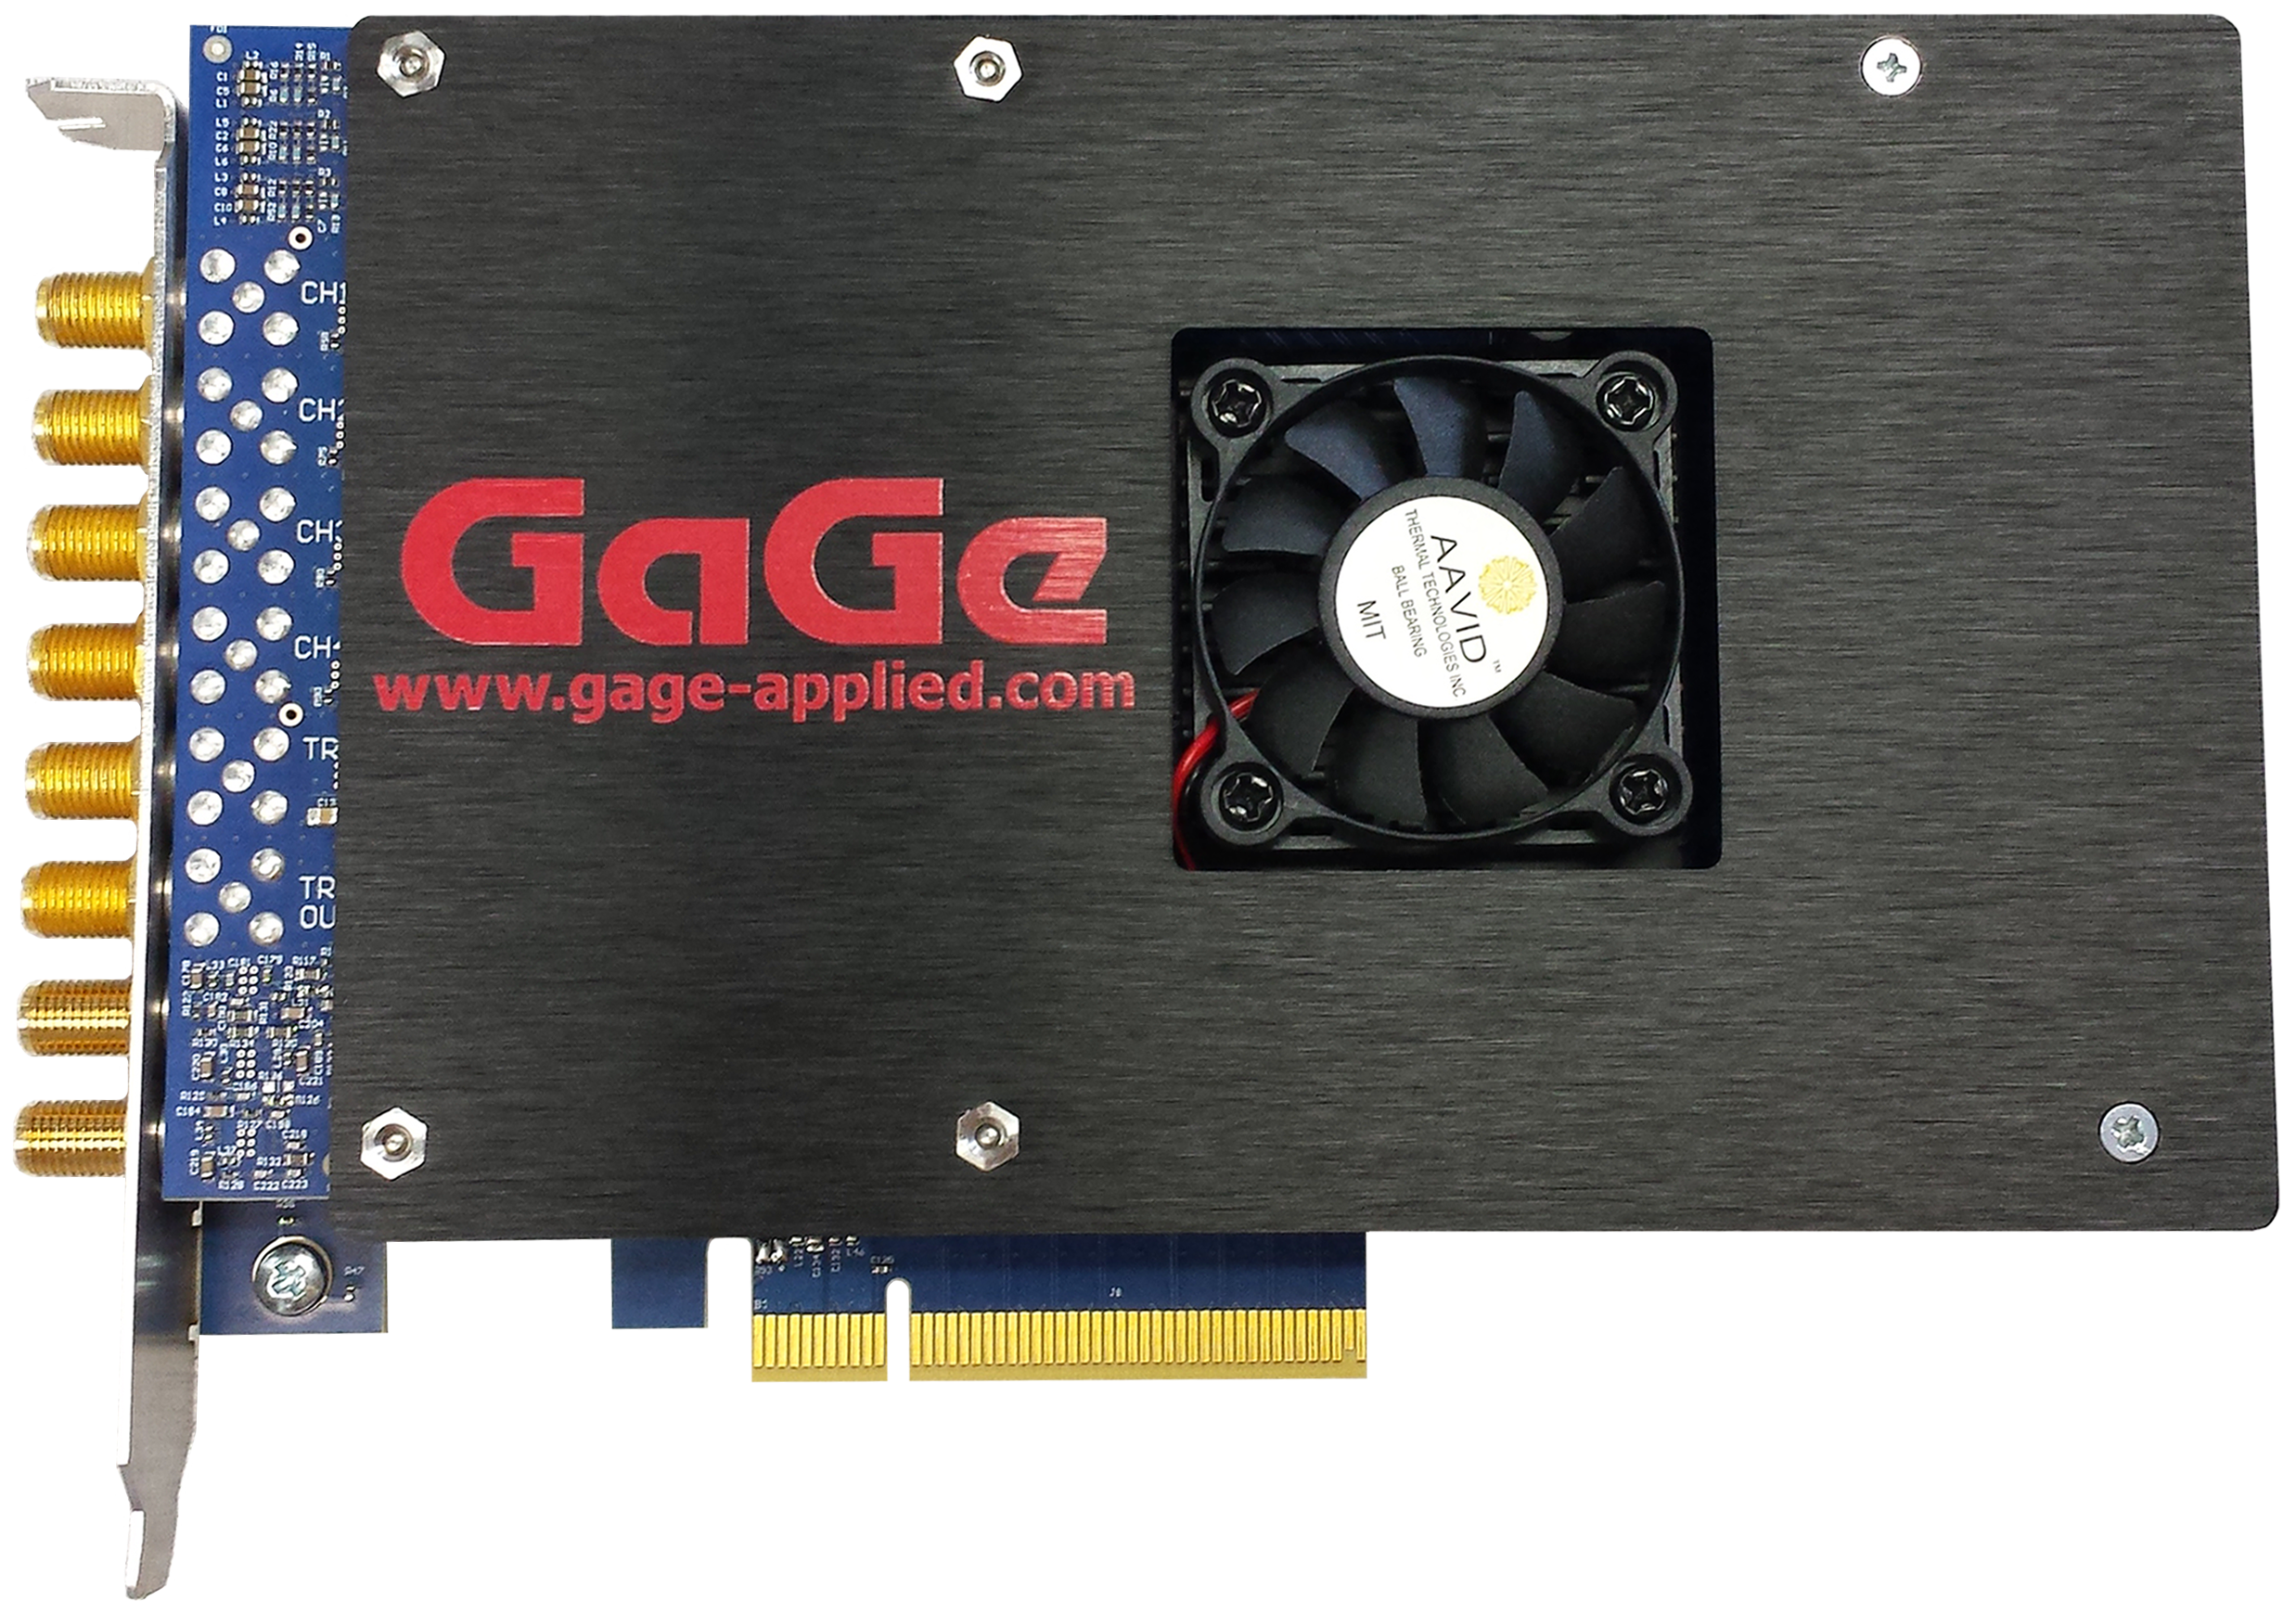
The GaGe RazorMax CSE161G2 is a 2-channel digitizer that can sample at up to 1 GS/s, as required. The RazorMax is a PC add-on card that resides within a PCI Express Gen3 x8 slot that is available in almost any modern commercial PC. The 16-bit resolution of the Razor-Max allows for a very low threshold of echo detectability, which will be extended even further, as described below.
The 6 mm depth requirement means that the sound will make a worst-case return trip of 12 mm, which is rounded up to 15 mm. A propagation speed estimate of 1500 m/s for tissue samples, gives a requirement to acquire the ultrasonic signal for 10 microseconds (μs) after excitation. Using the RazorMax’s 1 GS/s sampling rate, these acquisitions will therefore require an acquisition of (10 μs) /(1 GS/s) = 10,000 Samples.
The RazorMax can re-arm itself between successive waveform acquisition within 1 μs. Consequently, the RazorMax can trigger at rates of up to 90 kHz (= 1 / (10 μs + 1 μs) without missing triggers. The system will acquire waveforms at multiple positions scanned within a rectangular grid pattern. All operations are controlled by a Windows application written in the C programming language.
This article describes three techniques used in this application to improve ultrasonic signal acquisition. These are:
1. Usage of Dynamic Range Expansion (DRE) to maximize the detectability of small echoes.
2. High-speed PCI Express Data Streaming for the fastest scanning speed.
3. Usage of GaGe’s Trigger Out signal for efficient and synchronous ultrasonic triggering.
Dynamic Range Expansion (DRE)
Ultrasonic signals are often of high-dynamic range, which means that they contain both high and low amplitude echoes within the same signal. To extend the digitizer’s minimum echo detectability threshold, the user will employ Dynamic Range Expansion (DRE) [²]. To implement DRE, the user must split their raw ultrasonic signal with an RF power splitter, whose two outputs connect to two digitizer input channels after subjecting them to different external amplifications or attenuations.
Figure 2 shows the simulated 2-channel acquisition of an ultrasonic signal. Respectively shown in blue and red, the first splitter output signal is connected directly to the first digitizer channel while the second signal first passes through a 20X (26 dB) amplifier before its connection to the second digitizer channel. The signal acquisitions of Figure 2 were simulated for 8-bit digitization to demonstrate the power of DRE most clearly. The blue unamplified signal very clearly shows acquisition of the first echo, since it vertically spans most of the digitizer’s 256 digital levels (28 = 256). However, since it is 20X smaller than the first echo, the second echo spans only 2 or 3 levels, as shown in the magnified view of the blue signal. Clearly, this second echo would have been missed completely if it were any less than one-256th of the first echo amplitude.
With its external amplification of 20X, the red signal in Figure 2 shows that the first echo saturates the input and suffers extreme clipping. The magnified view, however, shows a much higher fidelity view of the second echo in red – simply because it now spans most of the 256 digital levels – instead of only two or three, as before. The recipe of DRE is to use the signal for each echo from the channel that best accommodates it – namely the unamplified channel for the larger first echo and the amplified channel for the second smaller echo. DRE only works because high and low amplitude echoes are separated in time and so may be examined on separate channels at separate times. DRE would not work, for example, if the high and low amplitudes components were separated in the frequency domain, since the resultant ubiquitous saturation of the signal would render it useless.
In addition to requiring temporal separation of different amplitude signal components, DRE imposes two other requirements upon the digitizer. First, the simultaneity of the two input channels much be excellent. Otherwise, calculation of Δt will be distorted by any interchannel time-skew. The RazorMax provides excellent inter-channel alignment with insignificant channel skews below 30 picoseconds.
Second, the recovery time of the RazorMax from saturation must be fast enough that any signal distortion after saturation does not persist until the second echo. From Figure 2, the recovery time of the RazorMax is clearly below 1 nanosecond and so is more than fast enough. Consequently, both the RazorMax and the user’s signal fulfill all the necessary requirements to use DRE.
In contrast to the 8-bit simulated case of Figure 2 where signal amplification was used, Figure 1 shows that the second signal passes through a signal attenuator. This compact, passive, in-line attenuator provides 12 dB (4X) of signal attenuation with no degradation before the signal enters the 16-bit RazorMax’s optional ±240 milliVolts input range. While the improvement afforded by DRE in this actual case is not as dramatic as for the simulation of Figure 2, the 4X difference in signal amplitudes will allow DRE to improve the echo detectability threshold by up to 4X.
PCI Express Streaming Acquisition
The customer’s data throughput and data volume impose demanding requirements upon the digitizer. As discussed above, typical waveforms will consist of 10,000 Samples on two channels. The 70 MHz ultrasonic frequency gives an ultrasonic wavelength in water (v ≈ 1500 m/s) of (1500 m/s) / (70 MHz) ≈ 20 μm. This wavelength roughly gives the diameter of the region isonified by the transducer at its focal point. For consistency, this diameter should be commensurate with the spatial scanning increment. Accordingly, the user has chosen to scan in a rectangular 2D grid with a 20 μm increment in each direction. With 2048 X 2048 grid points, the total grid area will be roughly 40 mm X 40 mm.
The total data volume will be:
Total Data per Image = 2 Ch * 2 Bytes/Sample * 10000 Samples/Waveform
* 2048 Waveforms/Line * 2048 Lines/Image
≈ 160 GigaBytes/Image
The large 8 GB memory onboard the RazorMax is far too small to hold all 160 GB of data for a single image. In traditional GaGe Memory Mode, this problem was overcome by stopping the RazorMax’s acquisition once its onboard memory was filled up and downloading all its data. This delay for download, however, would significantly retard the overall scan time.
The RazorMax’s onboard memory is dual-port – its contents may be written to and read from simultaneously. This feature enables RazorMax Streaming Mode, in which waveform data are streamed directly to the PCI Express (PCIe) bus through its onboard memory, which acts like a FIFO to absorb small bus latencies. Under the right conditions, Streaming Mode acquisition need not be stopped to download data and can continue uninterrupted throughout the image scan.
While it is more powerful, Streaming Mode is more sophisticated than Memory Mode and imposes three limitations. First, the aggregate data rate from the RazorMax cannot exceed the speed of the PCIe bus. Otherwise, the RazorMax’s onboard memory will be filled by new waveform data faster than it is emptied by the PCIe bus, which will eventually lead to memory overflow and data loss. Similarly, the aggregate data rate cannot exceed the rate at which the Streaming Target can consume the data stream, or an overflow will occur. For example, multiple parallel storage drives are often configured in a RAID array to allow a high streaming rate. Finally, software applications operating in Streaming Mode cannot be written in inefficient high-level languages that bottleneck the real-time throughput of the streamed data. Ideally, the software should be written in C, which has already been selected by the user.
If the acquired data stream were 100% continuous with no breaks and, then the aggregate output data rate from the RazorMax in this application would be: Data Rate = 2 Channel * 2 Bytes/Sample * 1000 MS/s = 4 GB/s.
The actual data rate will be less than 4 GB/s since the acquisition will not be 100% continuous but will be broken up by dead spaces between triggered 10,000 Sample waveforms. The GaGe RazorMax can indefinitely sustain data streaming rates up to 5.2 GB/s through its PCIe Gen3 x8 interface which is fast enough for this application.
The PCIe Target for the RazorMax’s data stream is PC RAM. In fact, in all streaming acquisitions the RazorMax streams its data to a pair of dual toggling PC RAM buffers from where the data is transferred to the Target. These buffers are allocated using special memory allocation routines provided by GaGe, since the RAM that constitutes them must be physical, contiguous, and limited in size (typically 10MB is used). In this application, the user must allocate a 160 GB conventional RAM buffer, which is virtual and non-contiguous. The user empties the toggling buffers into this 160 GB conventional buffer. Since the associated memory copy operations are very fast, there is no difficulty for the RAM to keep up with the incoming data stream.
After acquisition, the software application will hold all raw acquired waveform data in PC RAM. From there, the user can virtually examine different sections of the data, crop them, and create map images of ultrasonic parameters extracted from the raw waveforms. The user is not obligated to store the enormous volume of raw waveform data to storage but can save just cropped data subsets or even only reduced images.
Synchronous Triggering
Traditionally, ultrasonic systems configure a pulser/receiver to generate ultrasonic excitations at a regular interval. The pulser/receiver is usually equipped with a Sync pulse output that coincides with ultrasonic excitation and so can be used to externally trigger the digitizer. A shortcoming of this triggering scheme is that the Sync pulse is asynchronous or unrelated to the RazorMax’s 1 GHz sampling clock. The consequences of this asynchronicity are illustrated in Figure 3.
The multiple black trigger edges shown in Figure 3 represent Sync pulses from the pulser/receiver. These edges all result in the same indicated Trigger Point – whether the edge occurs just after the last Pre-Trigger Point or just before the Trigger Point. This ambiguity causes the corresponding repetitive signal acquisitions to dance left and right by exactly 1 Sample. This 1-Sample jitter is no failing of the GaGe digitizer but is a fundamental consequence of an asynchronous clock and trigger. Since the most important ultrasonic parameters are usually the positions of echo pulses, asynchronous triggering intrinsically limits the precision of such echo position measurements to 1 Sample.

Figure 3: Diagram indicating repetitive asynchronous triggers in black, whose edges wander in time with respect to the sample points. By contrast, the RazorMax’s synchronous Trigger Out pulse (shown in red) has an edge position that is fixed with respect to the sample points.
Like all GaGe digitizers, the RazorMax is equipped with a synchronous Trigger Out pulse, whose timing is shown in Figure 3. Unlike the black asynchronous triggers in Figure 3, the Trigger Out pulse is synchronous with the RazorMax’s sampling clock and so its rising edge always occurs at the same phase of the sampling clock. Accordingly, if the Trigger Out pulse is acquired by the RazorMax, then it will not jitter by 1-Sample. Instead, it will exhibit a much smaller jitter that is equal to the analog electrical jitter associated with the RazorMax’s components, which is typically less than one-tenth of a Sample. External triggering of the pulser/receiver with the Trigger Out pulse causes the ultrasonic excitation to inherit the synchronicity of the Trigger Out pulse [³] and so to also exhibit low jitter.
Figure 1 shows that the original source of the trigger pulse is the Position Encoder, which produces a pulse when the transducer reaches the next measurement position. This encoder functionality is sometimes called Pulse on Position (PoP). This set-up eliminates the need for any slow and non-deterministic software communication among the Position Encoder, the PC, and the RazorMax that would retard scanning speed. Instead, the Position Encoder directly triggers the RazorMax in hardware and no other synchronization through software is required.
The Trigger Out pulse is automatically generated by the RazorMax upon its external triggering by the Position Encoder, which in turn synchronously triggers the ultrasonic excitation. Using the triggering scheme described, the RazorMax provides the least possible signal jitter by using synchronous triggering of the ultrasonic pulser receiver. Furthermore, the fastest scanning time is achieved by triggering the RazorMax with a hardware trigger from the Position Encoder.
Conclusion
The GaGe RazorMax proves to have the required digitizer attributes for the application: namely, high 16-bit resolution for the detection of small echoes, high 1 GS/s sampling rate for the 70 MHz ultrasonic signal, a convenient PC form factor and a low price. In addition, this article has shown that the RazorMax can extend its excellent echo detectability threshold even further by using DRE. The RazorMax’s ability to stream data at over 5 GB/s allows for 0% dead-time with ultrasonic waveform being continuously acquired throughout the scan. Finally, synchronous triggering from Position Encoder allows for the fastest possible ultrasonic triggering with the lowest possible trigger jitter. The techniques described in this article may all be extended to other applications, such as laser microscopy and lidar.
For information on selecting the correct digitizer for your application contact GaGe-Sales@Vitrek.com or call (815) 838-0005.


