
Vitrek White Papers
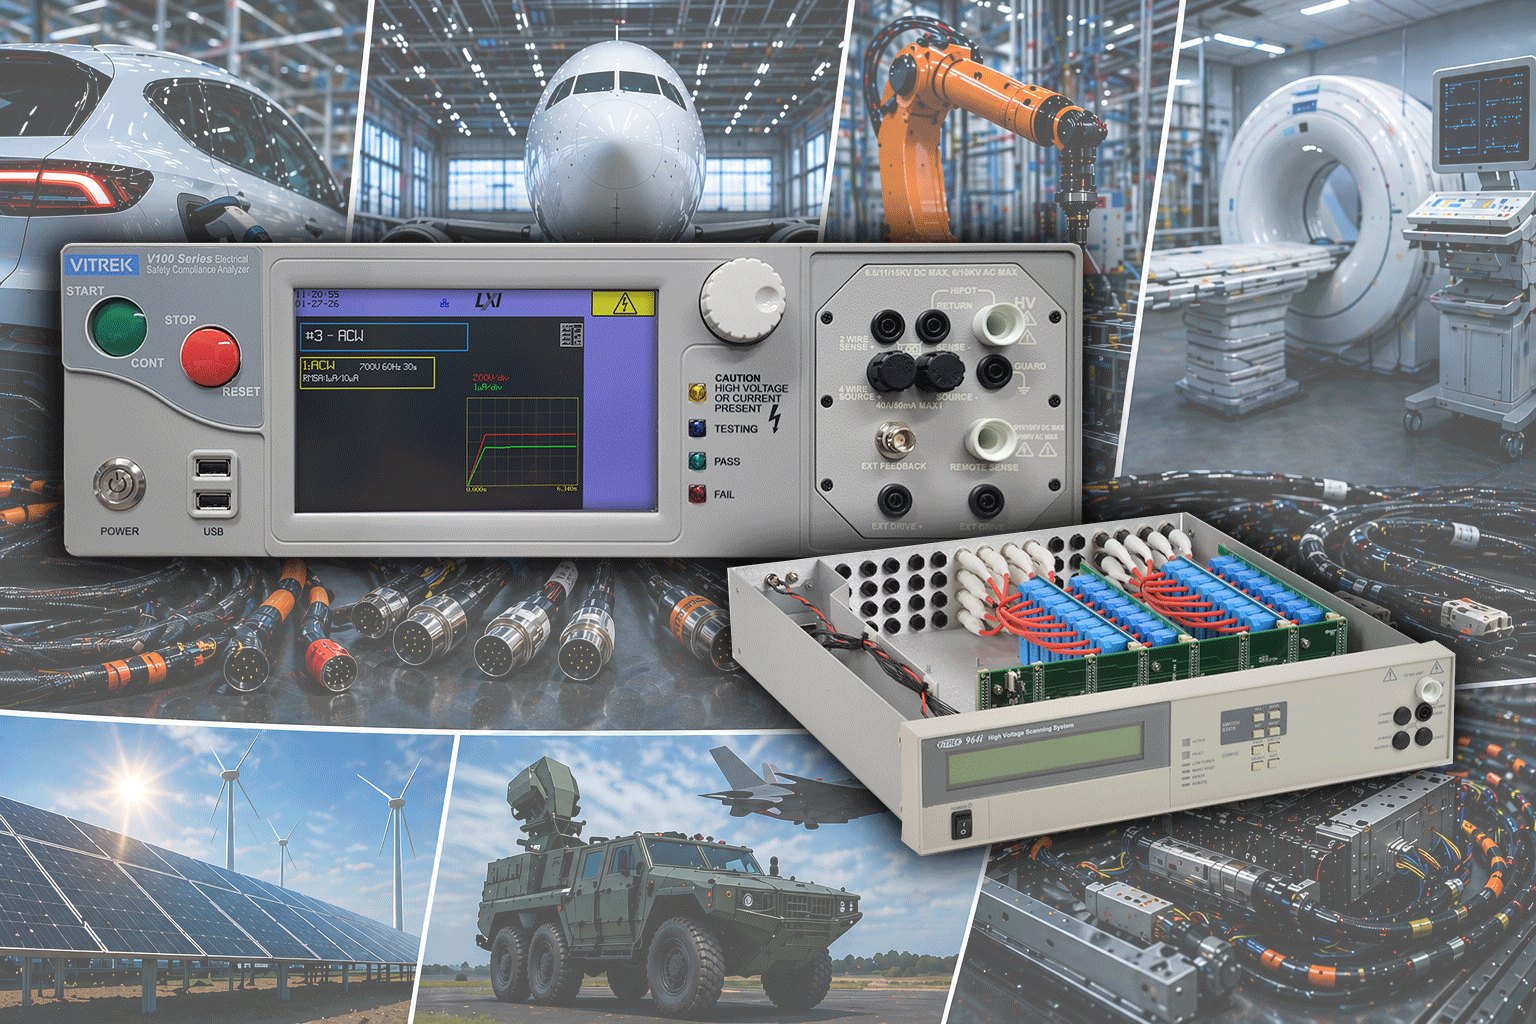 Whitepaper: The Future of Cable Testing: Why Intelligent Automation is Replacing Manual Validation Gallery
Whitepaper: The Future of Cable Testing: Why Intelligent Automation is Replacing Manual Validation
Brand-Vitrek, Industry-Aerospace, Industry-Automotive, Industry-Cable Test, Industry-Compliance Testing, Industry-Consumer Products, Industry-Electronics, Industry-Government/Military, Industry-Lighting, Industry-Manufacturing, Industry-Medical, New & Press Releases, Whitepapers-Vitrek
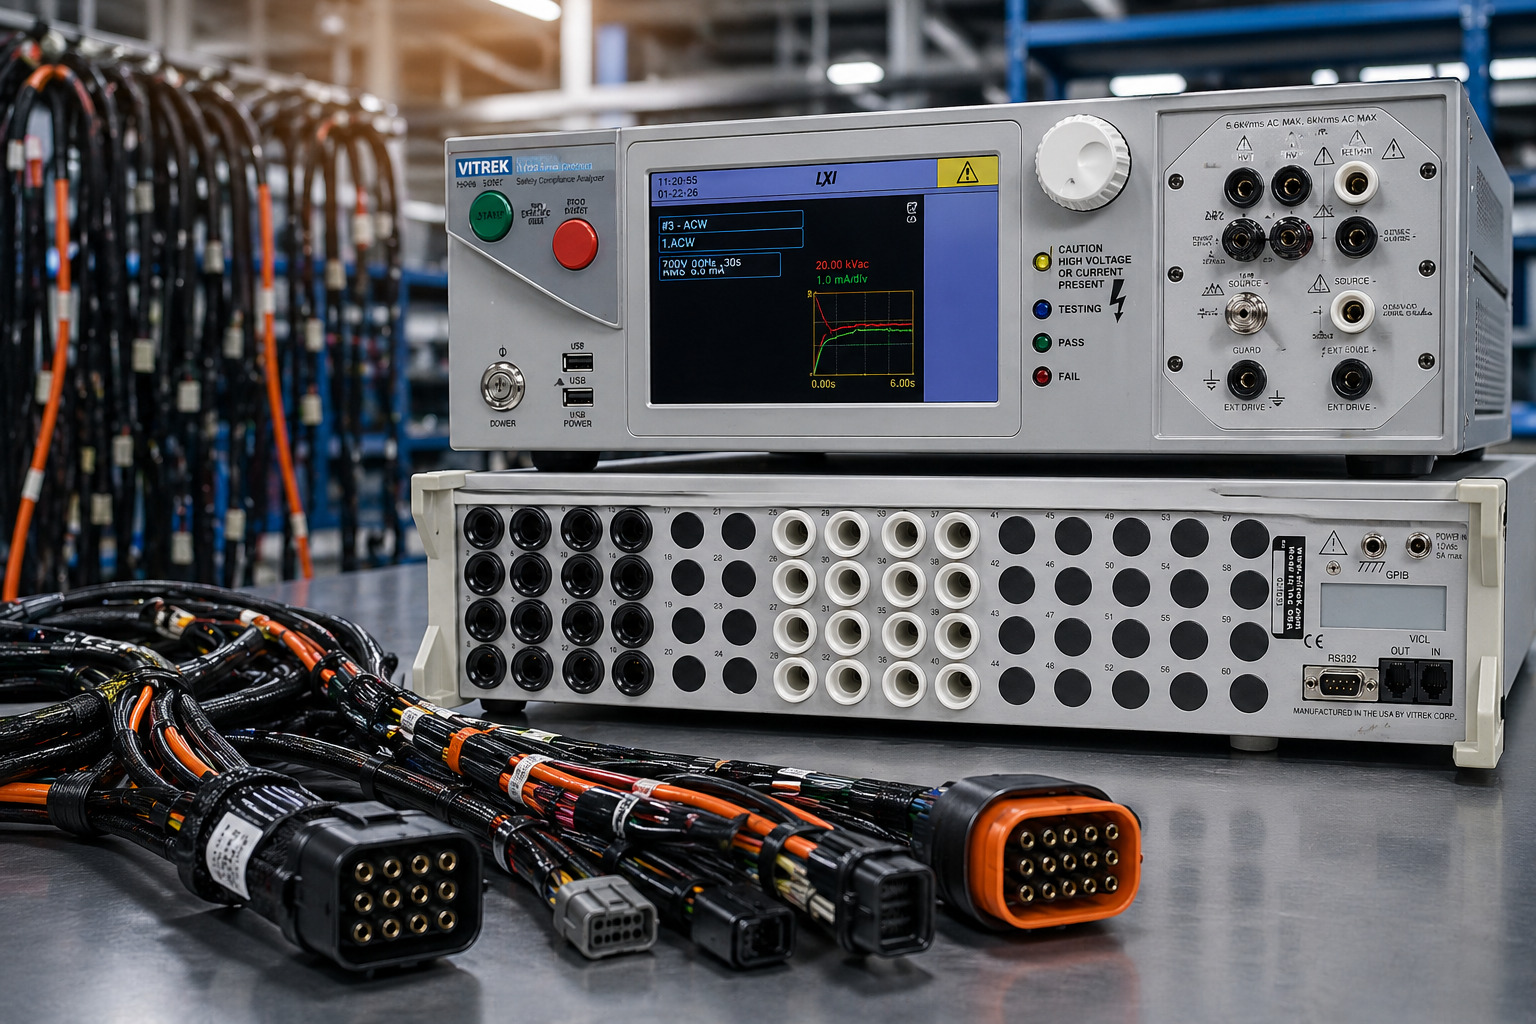 Automating Complex Cable Testing with the Vitrek V10X and 964i Gallery
Automating Complex Cable Testing with the Vitrek V10X and 964i
Application Notes-Vitrek, Brand-Vitrek, Industry-Aerospace, Industry-Automotive, Industry-Cable Test, Industry-Compliance Testing, Industry-Consumer Products, Industry-Electronics, Industry-Government/Military, Industry-Lighting, Industry-Manufacturing, Industry-Medical, Whitepapers-Vitrek
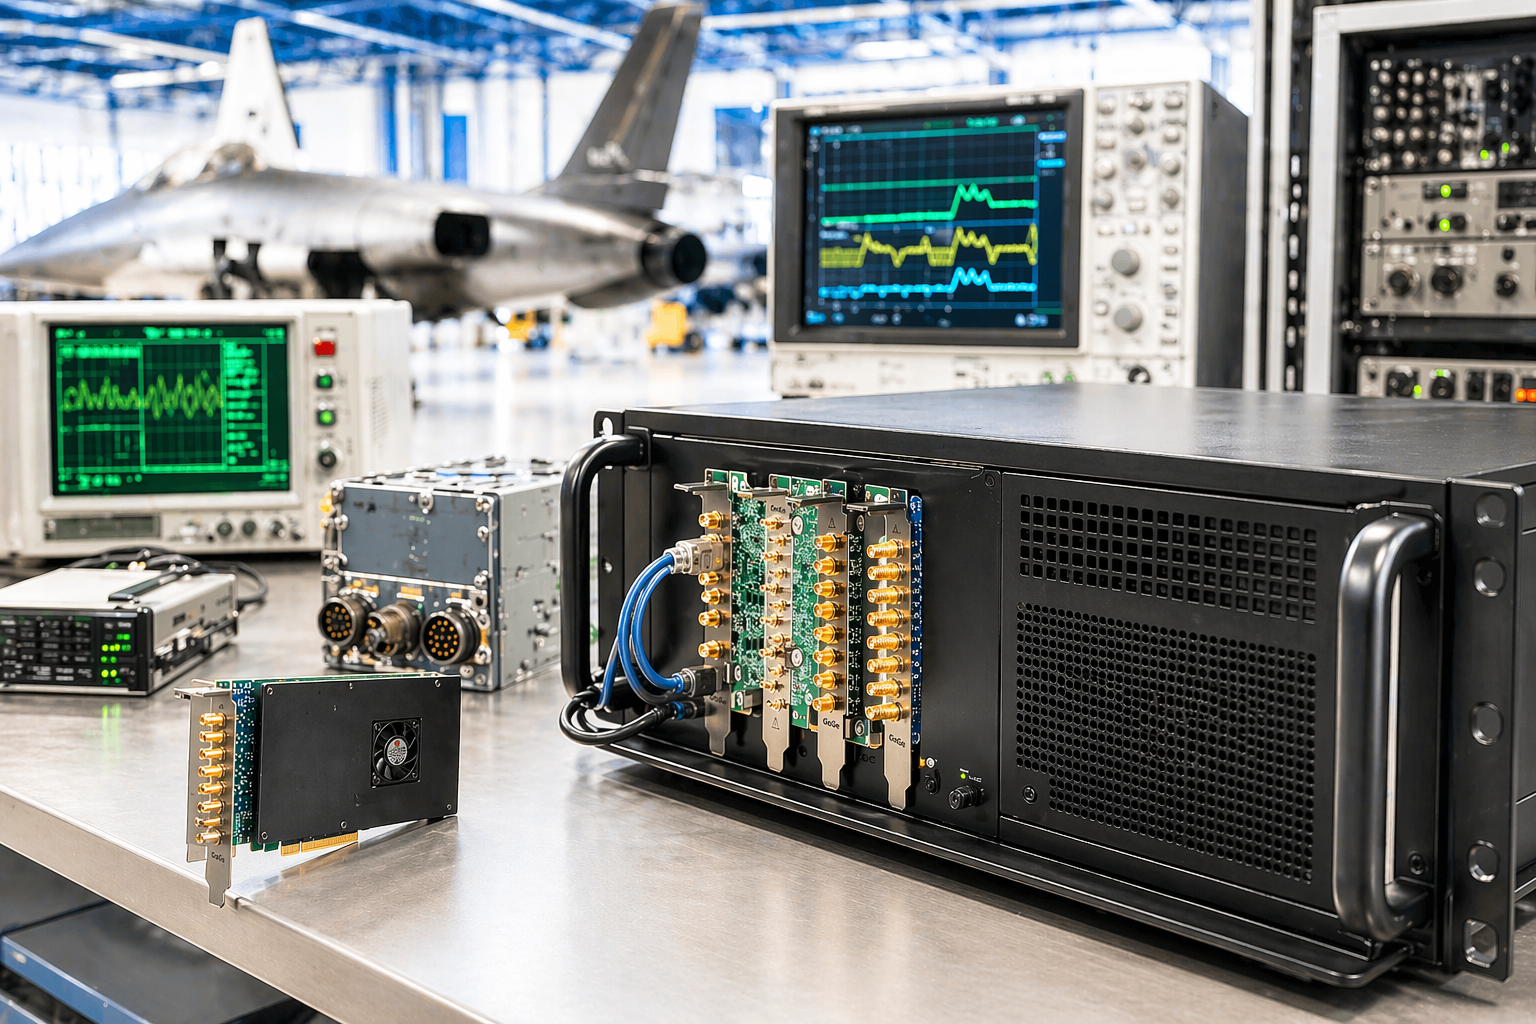
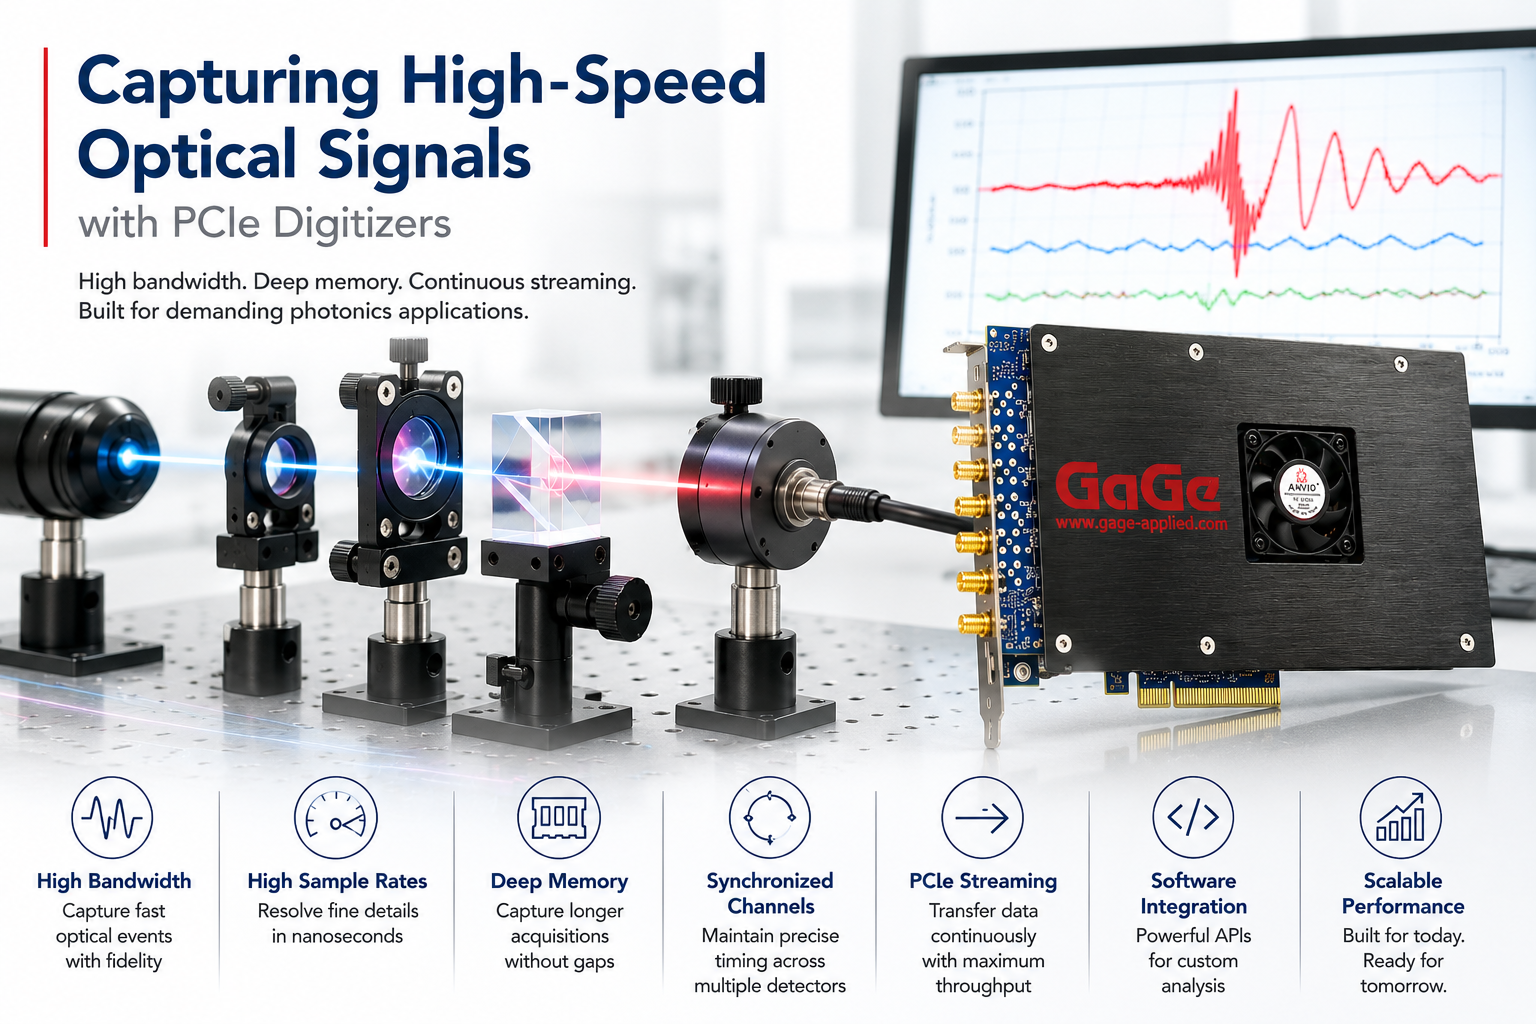
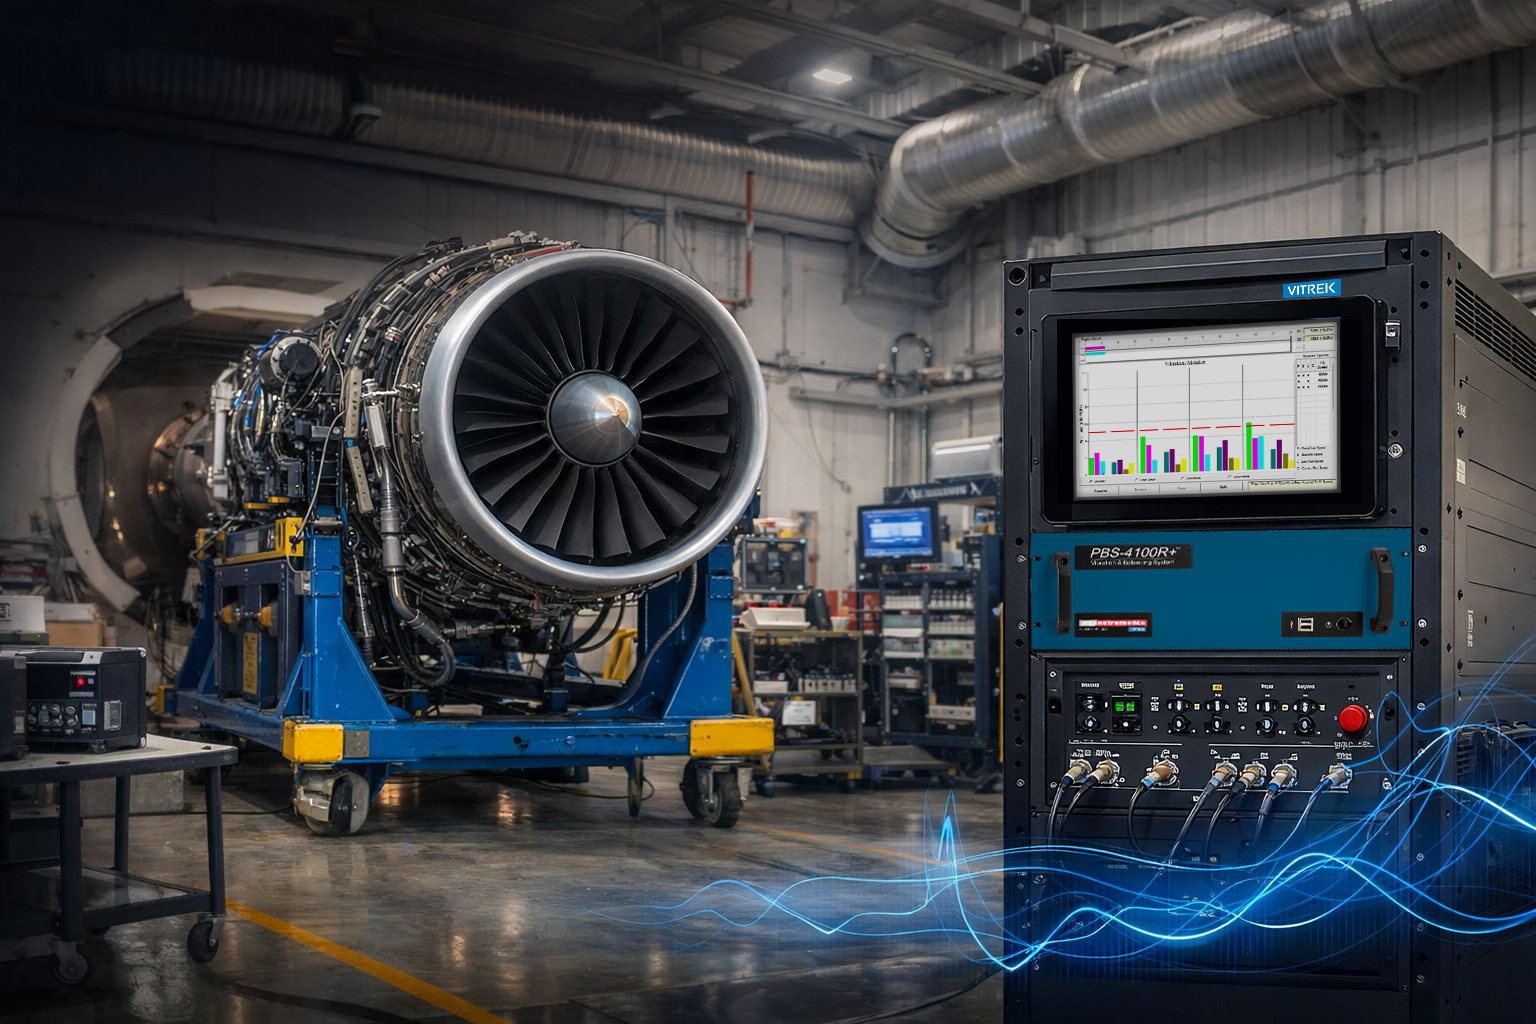 Application Note: Replace Three Legacy Systems with One: Modernizing Aerospace/Defense Test Cells with PBS eXpress Gallery
Application Note: Replace Three Legacy Systems with One: Modernizing Aerospace/Defense Test Cells with PBS eXpress
Application Notes-MTI, Brand-MTI, Industry-Aerospace, New & Press Releases, News-Industry, News-MTI, Whitepapers-MTI
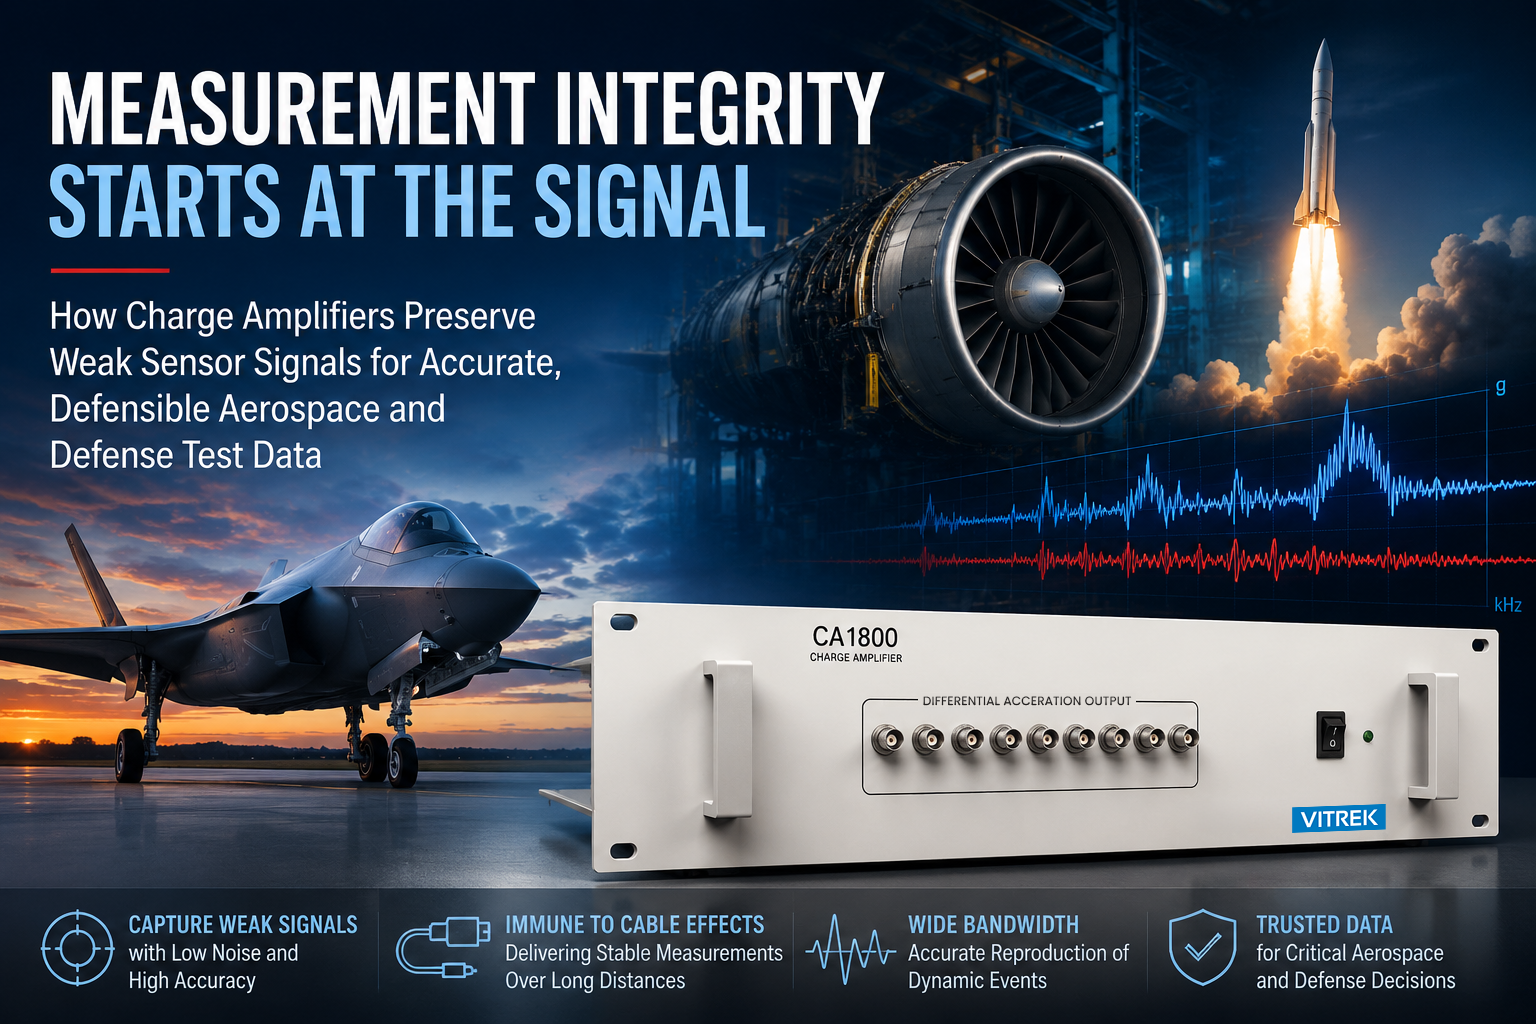
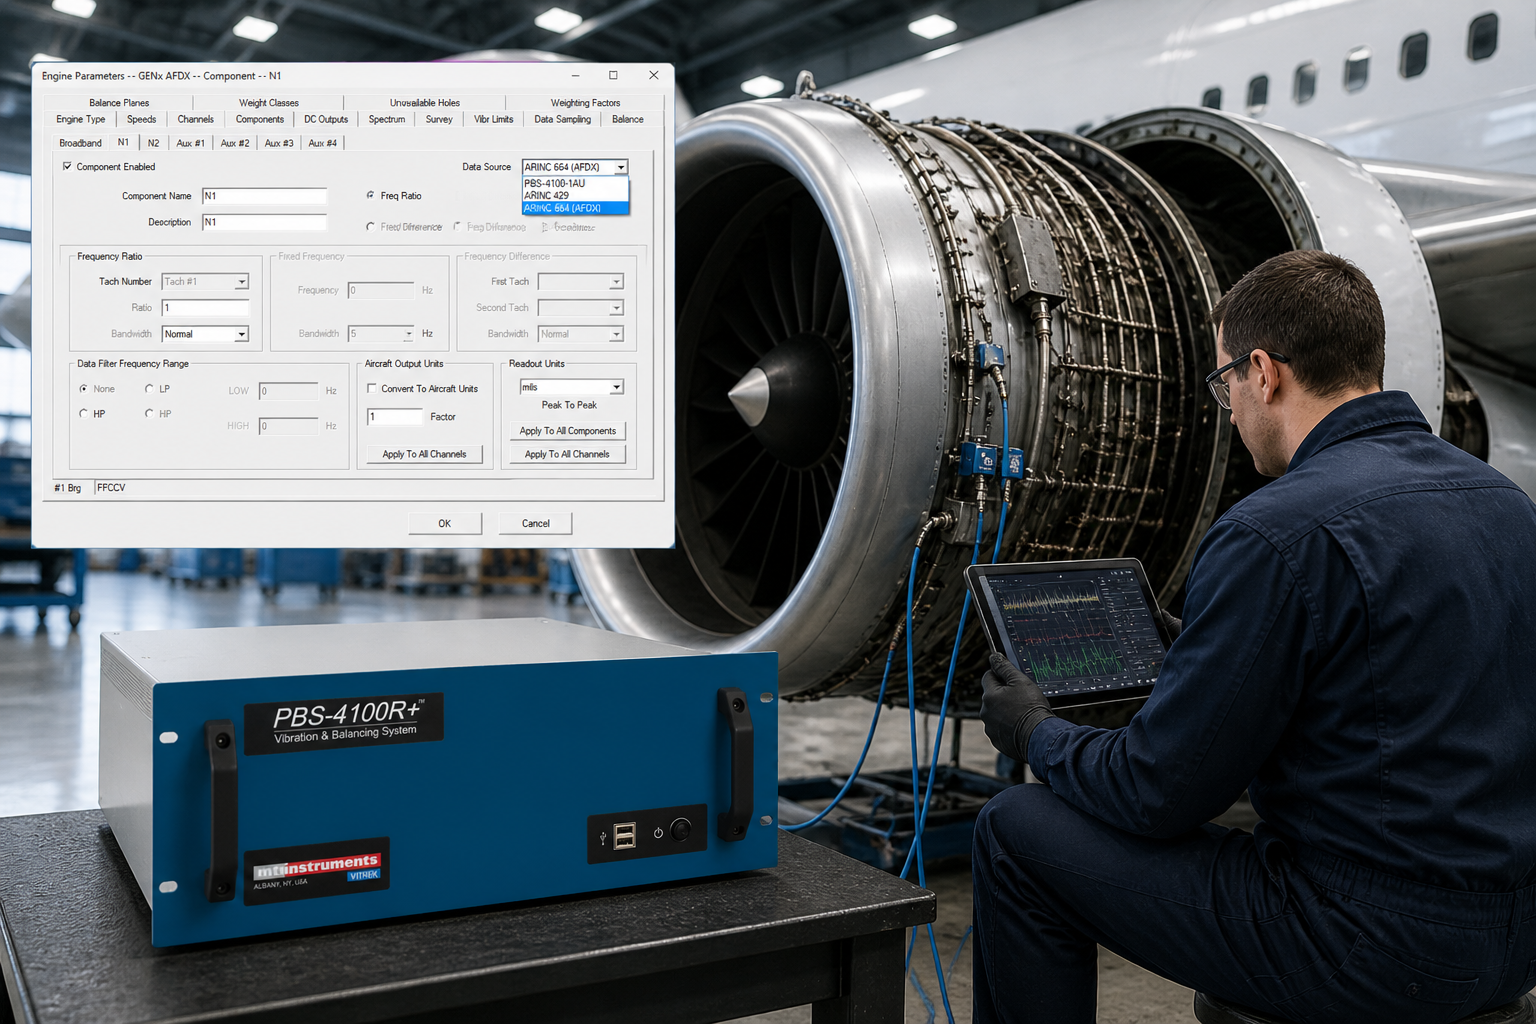
 Application Note: Accessing Digital Engine Data for Multi-Platform Aircraft Balancing with MTI PBS Systems Gallery
Application Note: Accessing Digital Engine Data for Multi-Platform Aircraft Balancing with MTI PBS Systems
Application Notes-MTI, Brand-MTI, Industry-Aerospace, New & Press Releases, News-Industry, News-MTI, Whitepapers-MTI
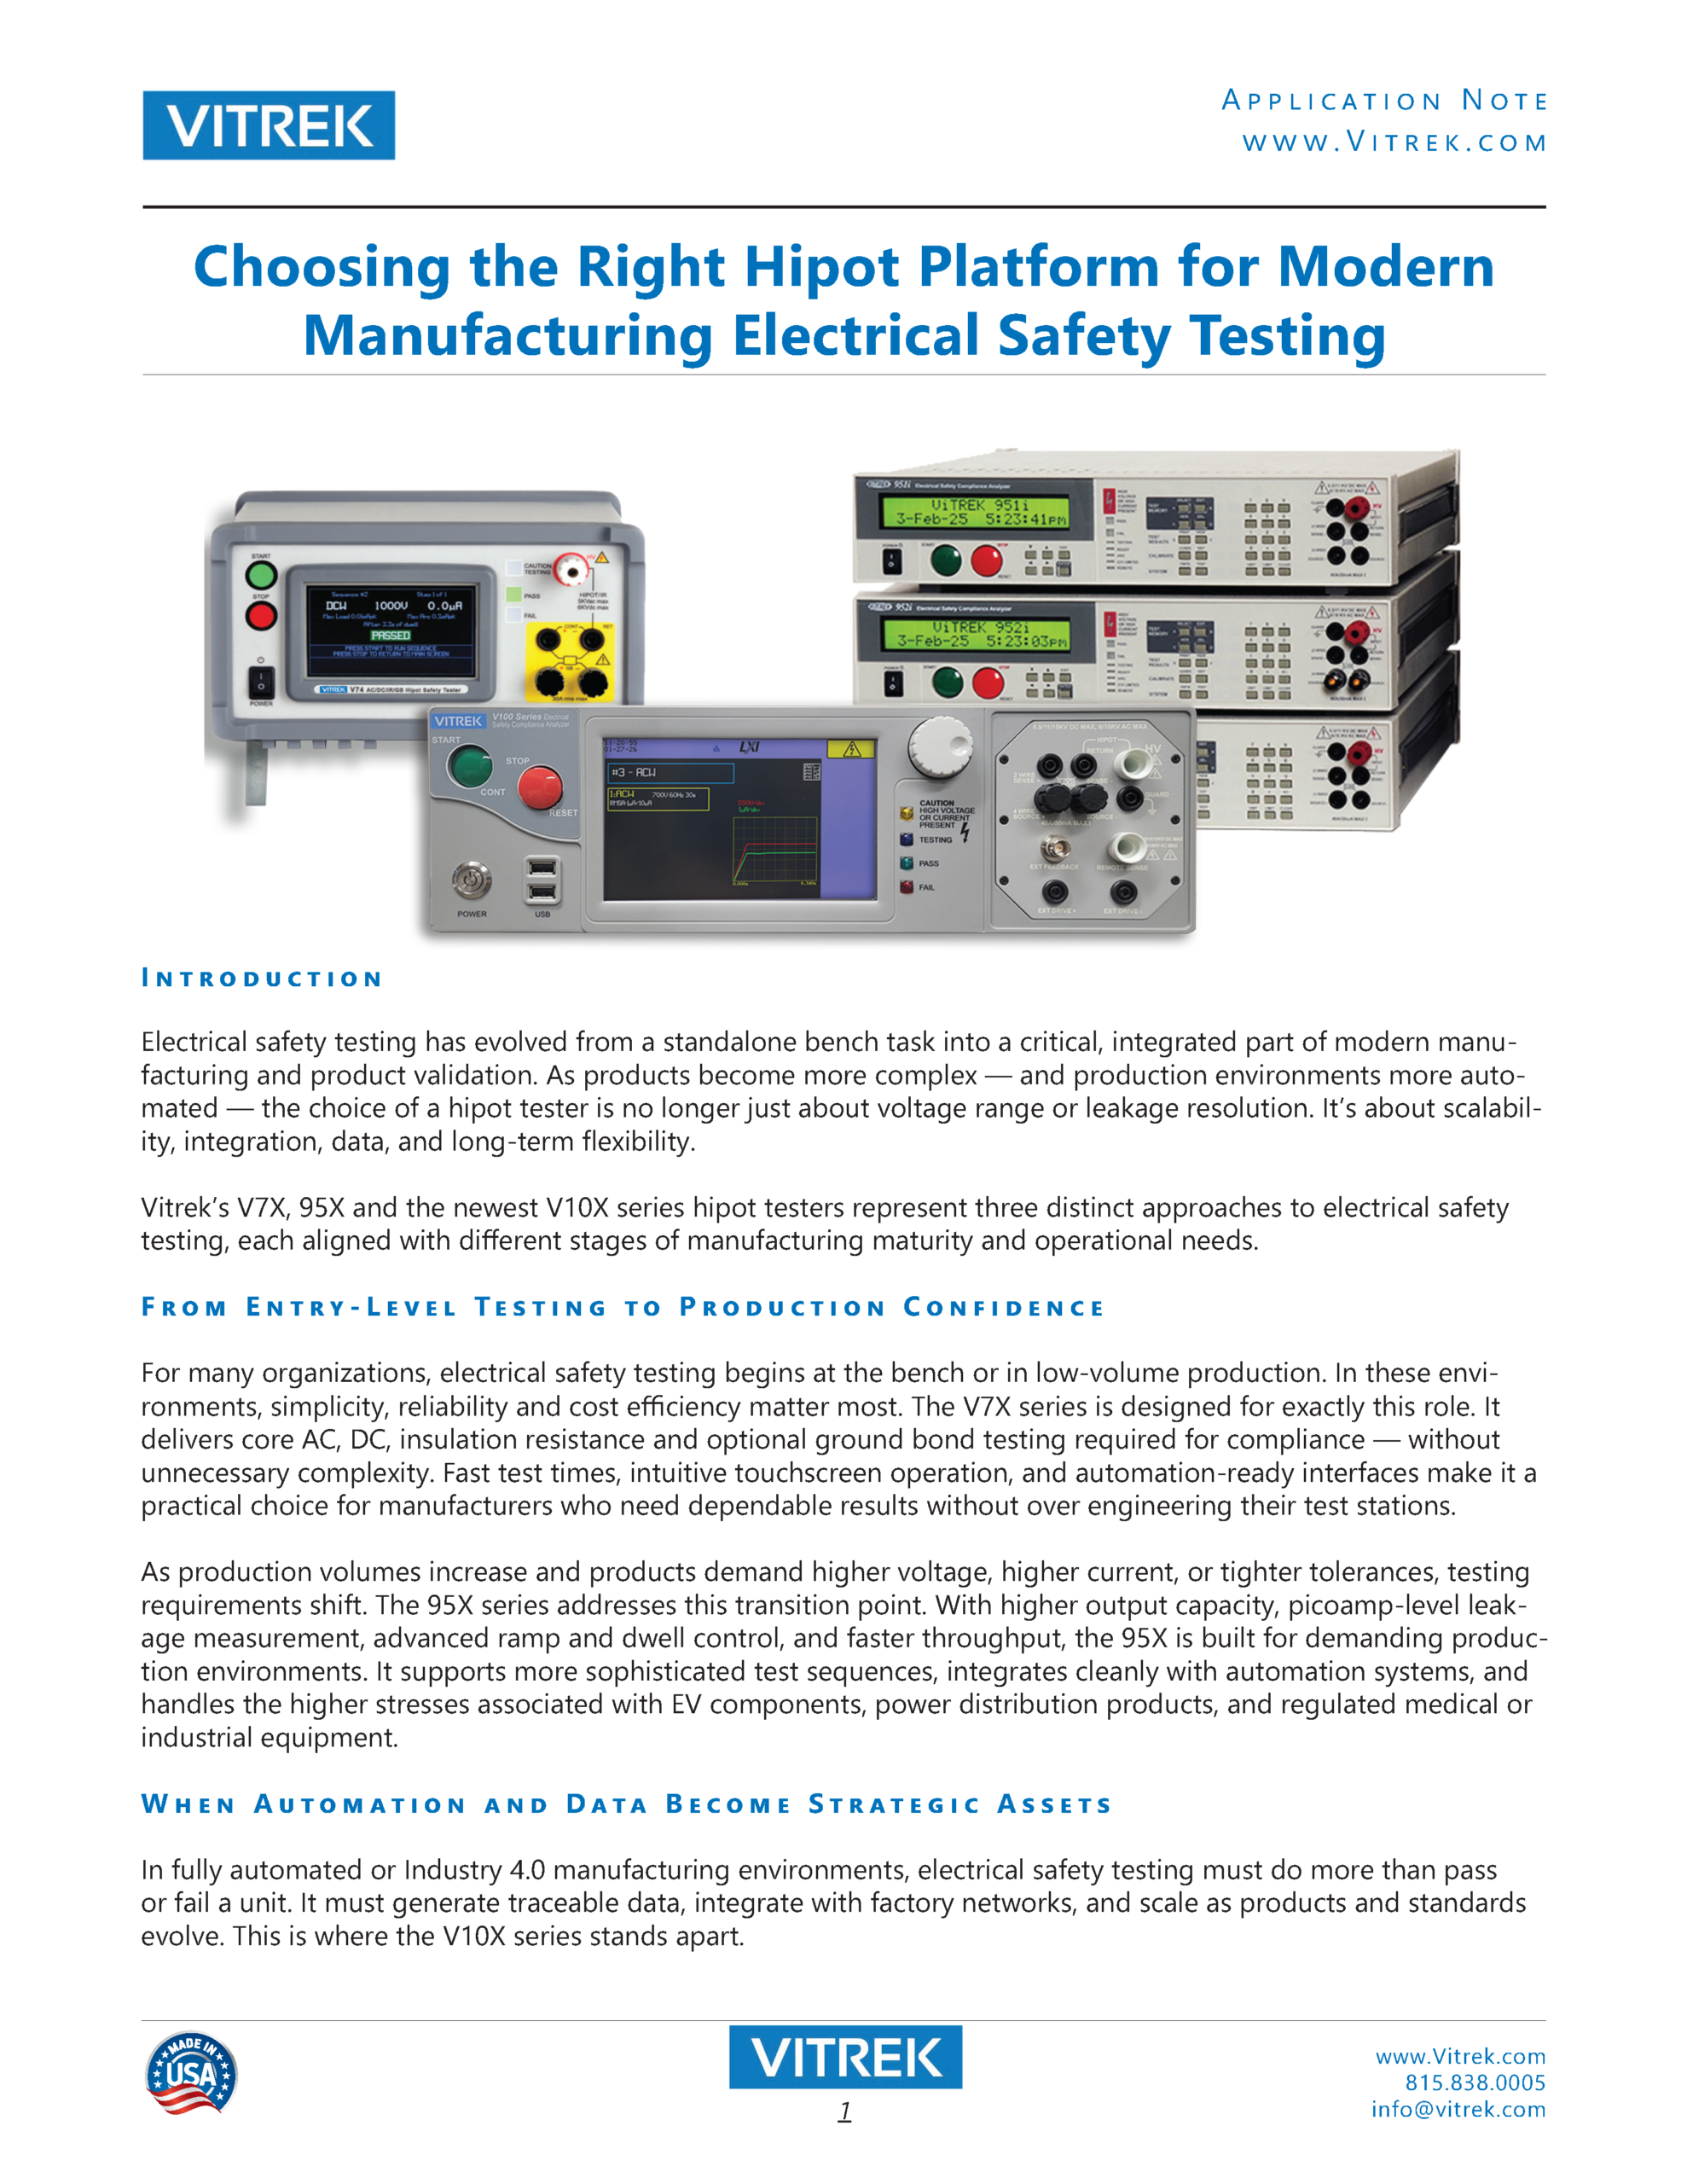 Choosing the Right Hipot Platform for Modern Manufacturing Electrical Safety Testing Gallery
Choosing the Right Hipot Platform for Modern Manufacturing Electrical Safety Testing
Articles-Vitrek, Industry-Automotive, Industry-Battery, Industry-Cable Test, Industry-Compliance Testing, Industry-Consumer Products, Industry-Electronics, Industry-Government/Military, Industry-Lighting, Industry-Manufacturing, Industry-Medical, Industry-R&D, Knowledge Center-Vitrek, New & Press Releases, Whitepapers-Vitrek

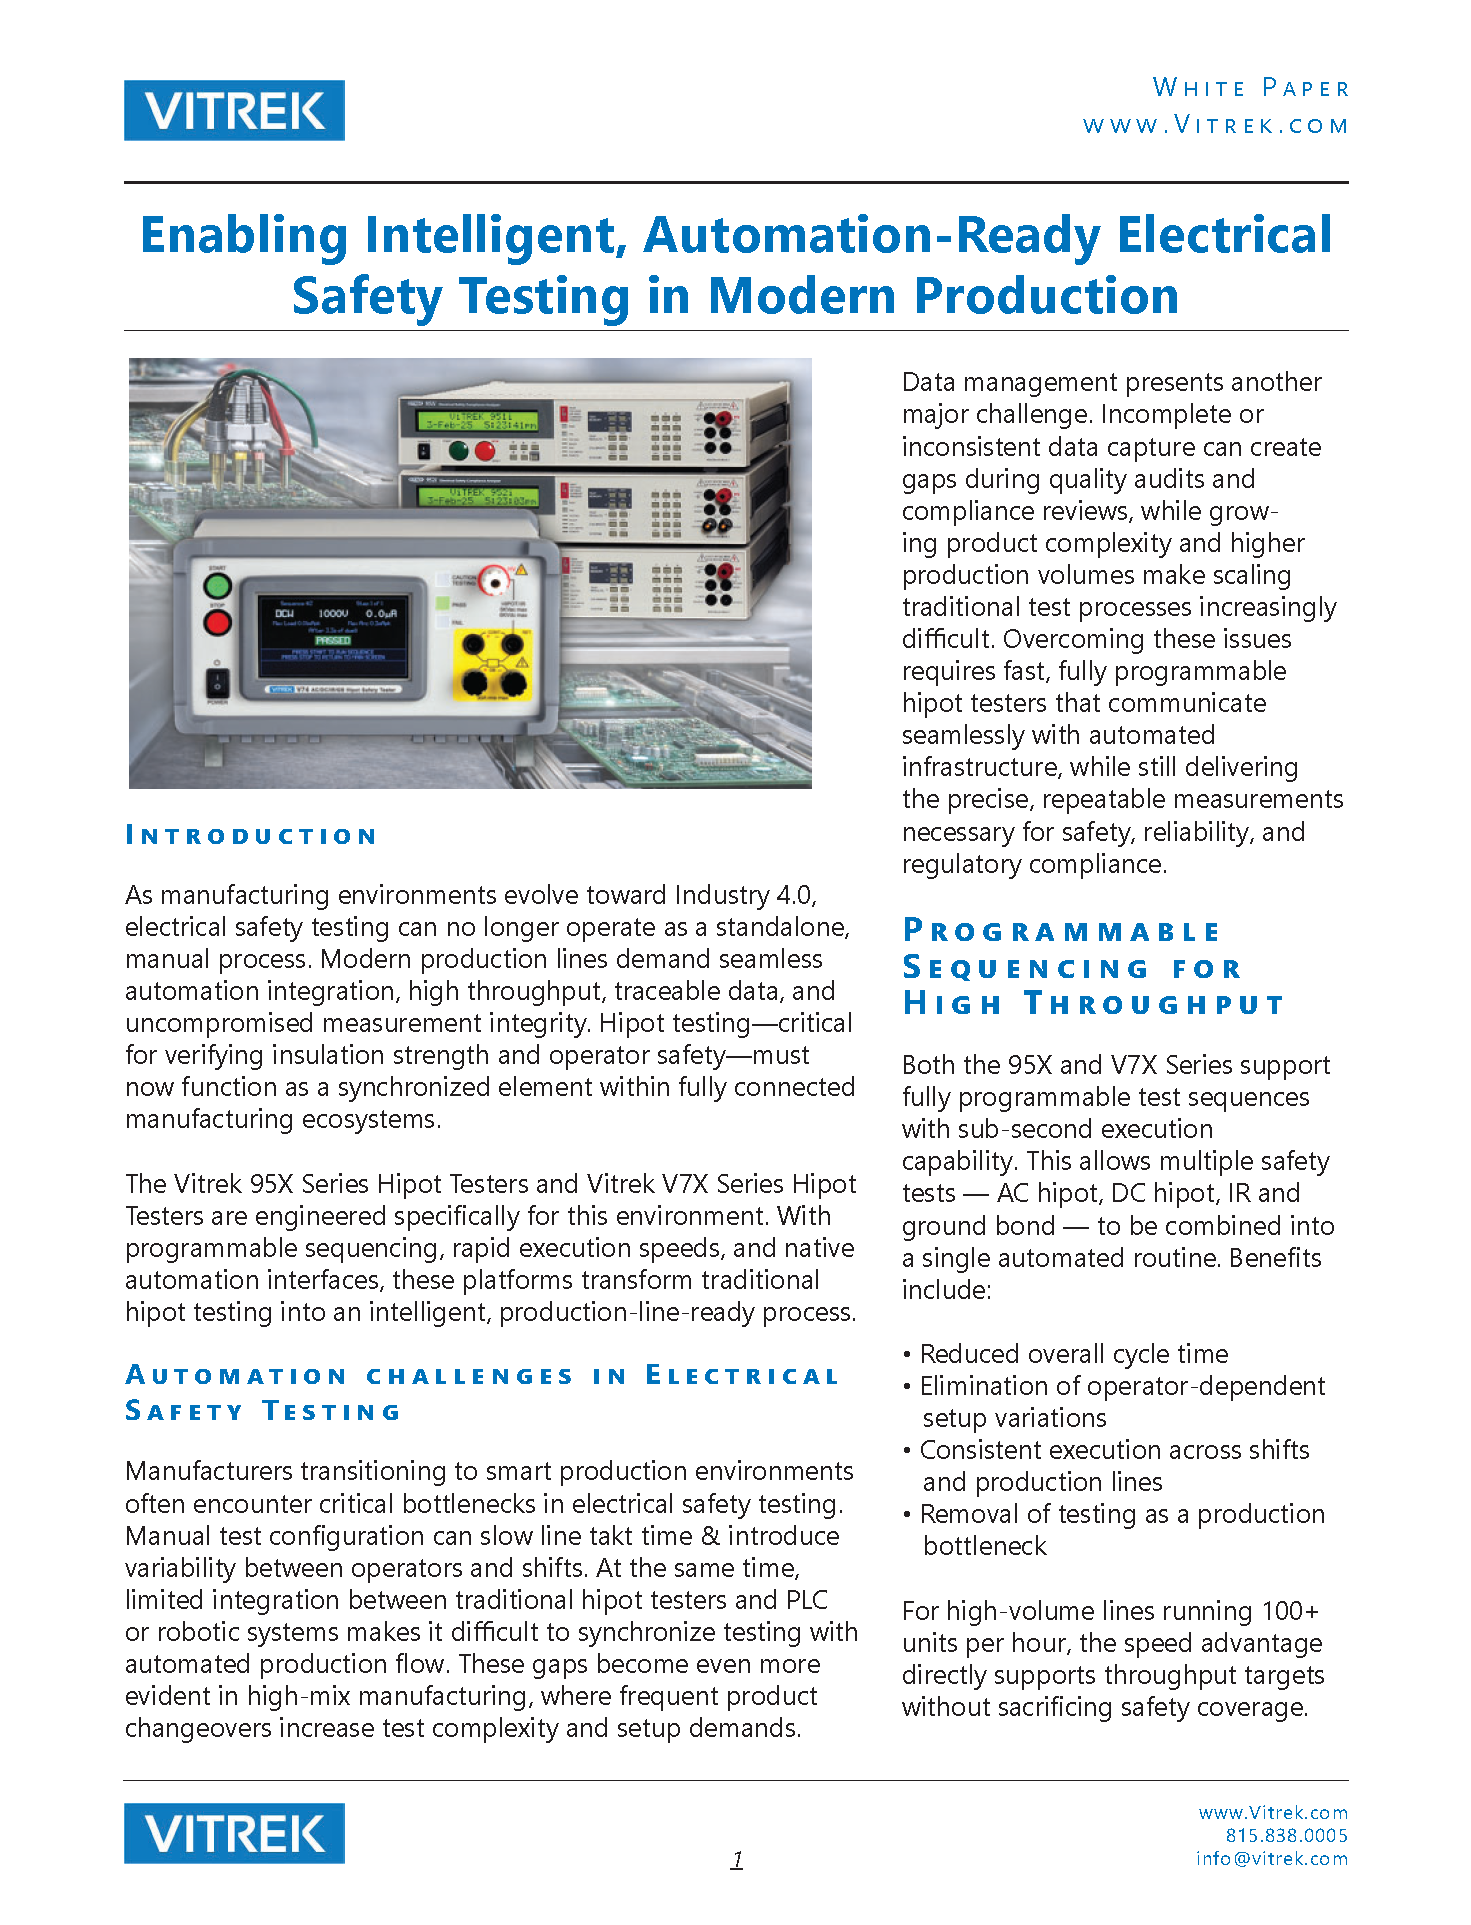 Enabling Intelligent, Automation-Ready Electrical Safety Testing in Modern Production Gallery
Enabling Intelligent, Automation-Ready Electrical Safety Testing in Modern Production
Application Notes-Vitrek, Brand-Vitrek, Industry-Compliance Testing, Industry-Electronics, Industry-Manufacturing, Industry-Measurement Applications, Whitepapers-Vitrek
 Testing Energy-Efficient Washing Machines with the PA900 Power Analyzer Gallery
Testing Energy-Efficient Washing Machines with the PA900 Power Analyzer
Application Notes-Vitrek, Brand-Vitrek, Industry-Compliance Testing, Industry-Electronics, Industry-Manufacturing, Industry-Measurement Applications, Whitepapers-Vitrek
 Ultra-Low Standby Power Testing Made Simple with Vitrek Power Analyzers and EN50564:2011 Gallery
Ultra-Low Standby Power Testing Made Simple with Vitrek Power Analyzers and EN50564:2011
Application Notes-Vitrek, Brand-Vitrek, Industry-Compliance Testing, Industry-Electronics, Industry-Manufacturing, Industry-Measurement Applications, Whitepapers-Vitrek

 Power Analyzers: The Backbone of Modern Electrical Engineering Gallery
Power Analyzers: The Backbone of Modern Electrical Engineering
Brand-Vitrek, Industry-Automotive, Industry-Compliance Testing, Industry-Consumer Products, Industry-Energy, Industry-Manufacturing, Industry-Medical, Industry-Medical, Industry-OEM, Industry-R&D, Industry-Semiconductor, News-All Brands, Products-Vitrek-Power-Analyzer, Whitepapers-Vitrek

 Application Note: Maximizing High-Voltage Measurement Accuracy with the Vitrek 4700 Gallery
Application Note: Maximizing High-Voltage Measurement Accuracy with the Vitrek 4700
Brand-Vitrek, Industry-Cable Test, Industry-Compliance Testing, Industry-Manufacturing, Products-Vitrek-4700, Whitepapers-Vitrek, z1


 Whitepaper: Mastering High Voltage: The Importance of Accurate Test Equipment Gallery
Whitepaper: Mastering High Voltage: The Importance of Accurate Test Equipment
Industry-Cable Test, Industry-Compliance Testing, Industry-Consumer Products, Industry-Electronics, Industry-Manufacturing, Industry-Measurement Applications, Knowledge Center-Vitrek, News-Vitrek, Whitepapers-Vitrek

 Did You Know? GaGe RazorMax Express Digitizer/Oscilloscope: An Efficient & Cost-Effective Tool for High-Energy Physics Particle Counting Applications Gallery
Did You Know? GaGe RazorMax Express Digitizer/Oscilloscope: An Efficient & Cost-Effective Tool for High-Energy Physics Particle Counting Applications
Brand-GaGe, Industry-Government/Military, Industry-Measurement Applications, Industry-Medical, Industry-R&D, Industry-Semiconductor, Industry-Semiconductor-GaGe, Knowledge Center-GaGe, Whitepapers-GaGe

 Case-In-Point: MTI Turbine Vibration Analyzer/Balancing System Technology Principles Gallery
Case-In-Point: MTI Turbine Vibration Analyzer/Balancing System Technology Principles
Application Notes-MTI, Articles-MTI, Industry-Aerospace, Industry-Compliance Testing, Industry-Government/Military, Industry: Transportation, Knowledge Center-MTI, News-Industry, News-MTI-PBS, Whitepapers-MTI
 Article: High-Performance Digitizers in Semiconductor Manufacturing Applications Gallery
Article: High-Performance Digitizers in Semiconductor Manufacturing Applications
Application Notes-GaGe, Articles-GaGe, Industry-Compliance Testing, Industry-Semiconductor, Industry-Semiconductor-GaGe, Knowledge Center-GaGe, News-GaGe, News-Industry, Whitepapers-GaGe
 MTI Instruments Whitepaper: Capacitance Guide for Industrial Applications Gallery
MTI Instruments Whitepaper: Capacitance Guide for Industrial Applications
Brand-MTI, Industry-Aerospace, Industry-Automotive, Industry-Battery, Industry-Compliance Testing, Industry-Consumer Products, Industry-Electronics, Industry-Energy, Industry-Government/Military, Industry-Industrial Processing, Industry-Lighting, Industry-Manufacturing, Industry-Measurement Applications, Industry-OEM, Industry-R&D, Industry-Semiconductor, Industry-Semiconductor-MTI, Industry-Sensors, Industry: Transportation, Knowledge Center-MTI, News-MTI, Whitepapers-MTI

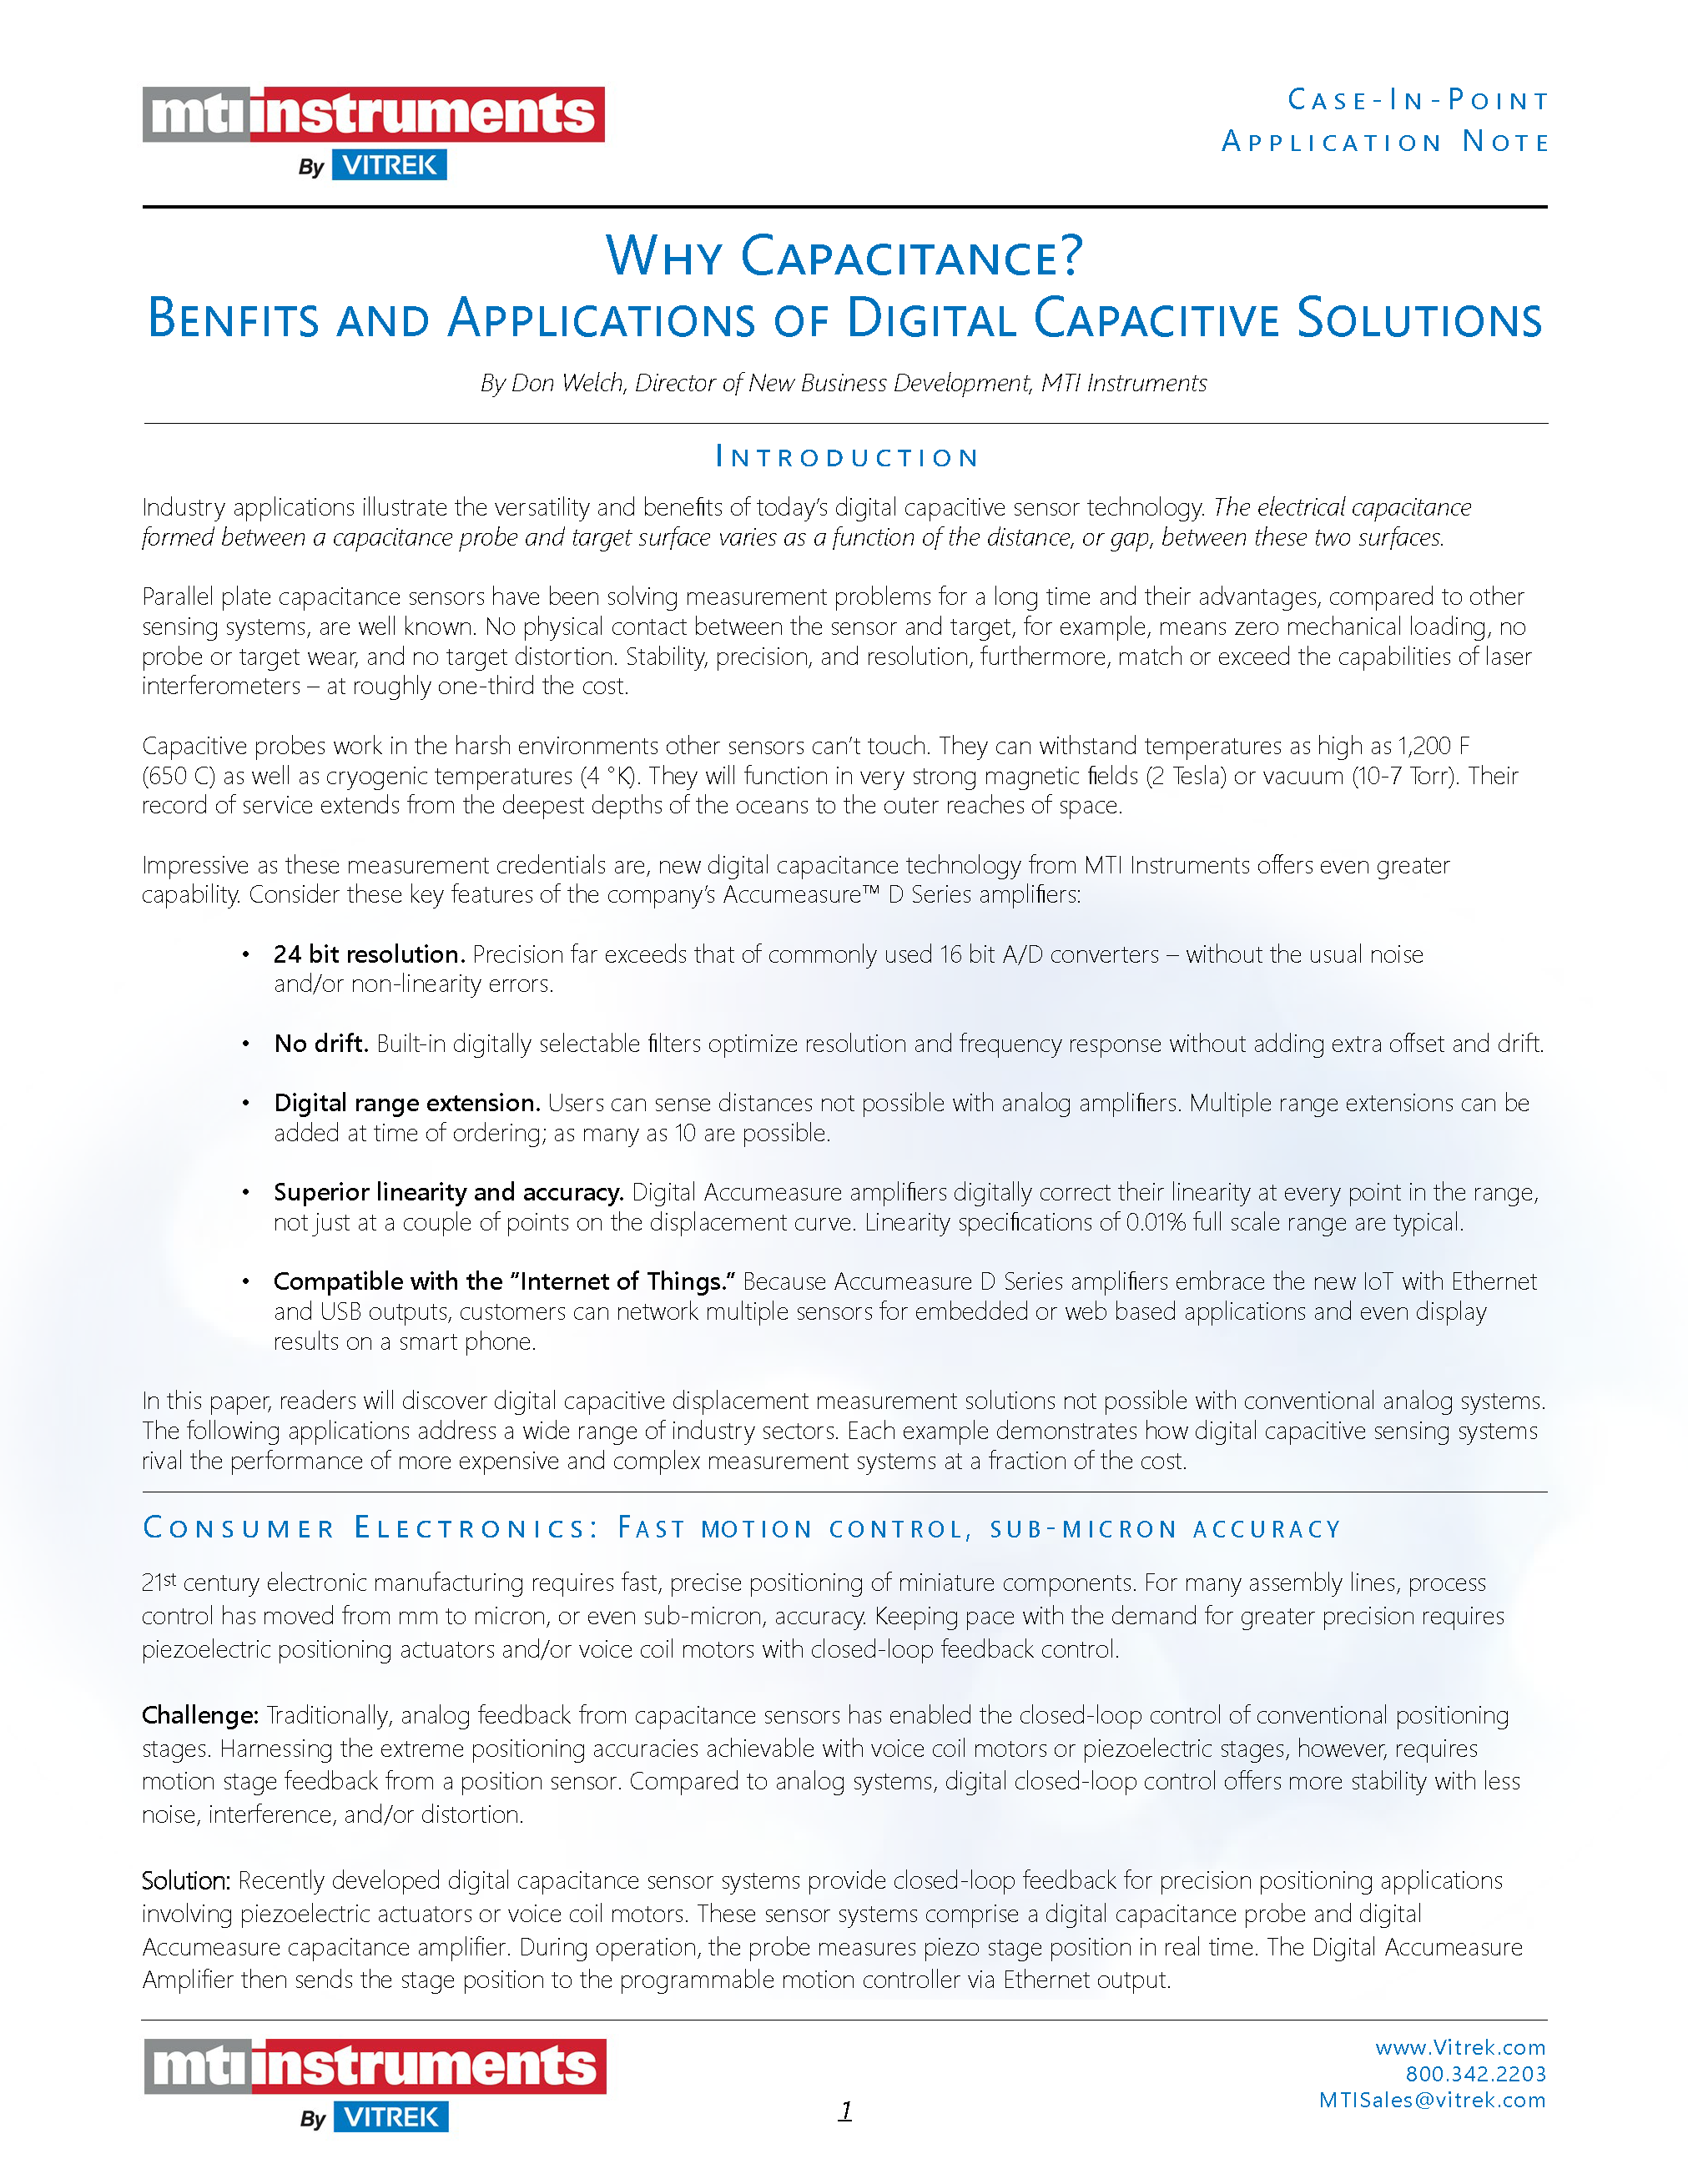 Whitepaper: Why Capacitance? Benefits and Applications of Digital Capacitive Sensors Gallery
Whitepaper: Why Capacitance? Benefits and Applications of Digital Capacitive Sensors
Brand-MTI, Industry-Automotive, Industry-Compliance Testing, Industry-Consumer Products, Industry-Electronics, Industry-Industrial Processing, Industry-Manufacturing, Industry-Measurement Applications, Industry-Semiconductor, Industry-Semiconductor-MTI, Industry-Sensors, Knowledge Center-MTI, News-MTI, News-Vitrek, Whitepapers-MTI
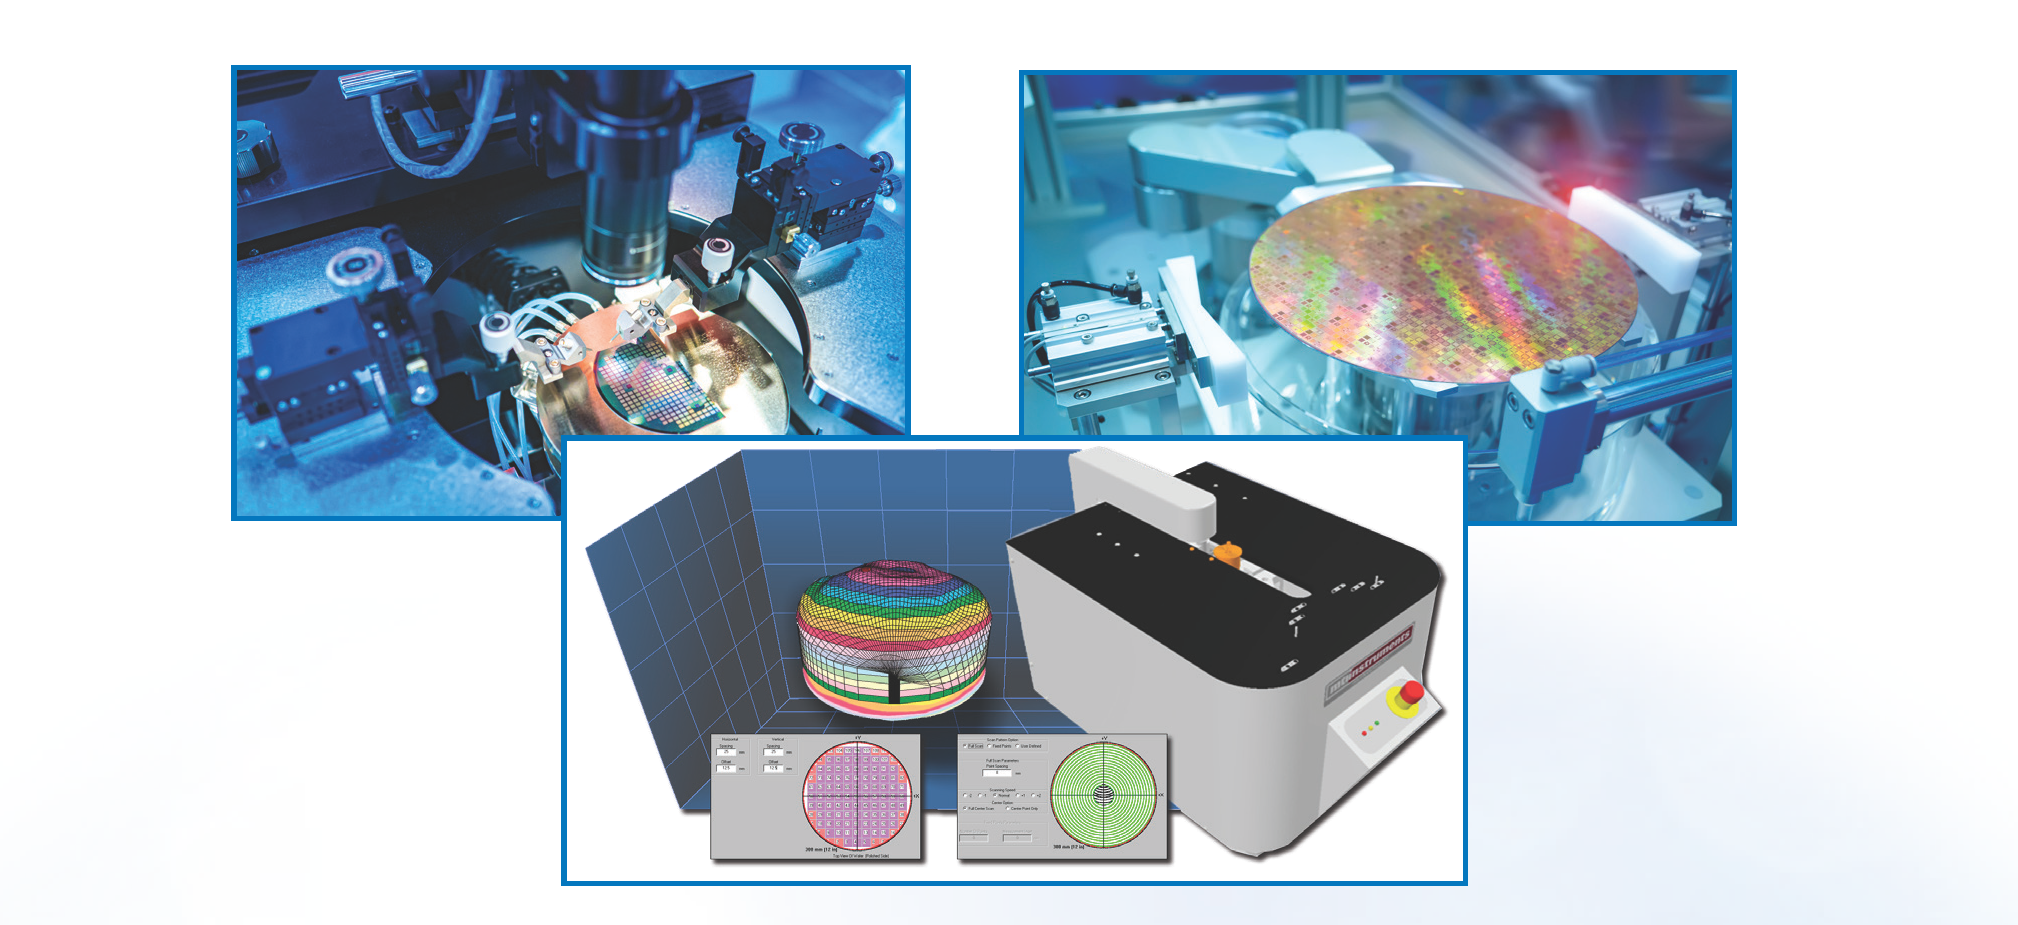 Whitepaper: Semiconductor Wafer Measurement for Increased Productivity Gallery
Whitepaper: Semiconductor Wafer Measurement for Increased Productivity
Brand-GaGe, Brand-MTI, Brand-Vitrek, Brands-All, Industry-Consumer Products, Industry-Electronics, Industry-Manufacturing, Industry-OEM, Industry-Semiconductor, Industry-Semiconductor-MTI, Knowledge Center-MTI, News-Industry, News-MTI, Whitepapers-MTI


 GaGe Whitepaper: Wide Bandwidth Digitizer Provides Essential Data Processing in an Innovative Real-Time Channel Sounder for 5G Applications Gallery
GaGe Whitepaper: Wide Bandwidth Digitizer Provides Essential Data Processing in an Innovative Real-Time Channel Sounder for 5G Applications
Industry-Aerospace, Industry-Consumer Products, Industry-Electronics, Industry-Government/Military, Whitepapers-GaGe, z1, ZOK



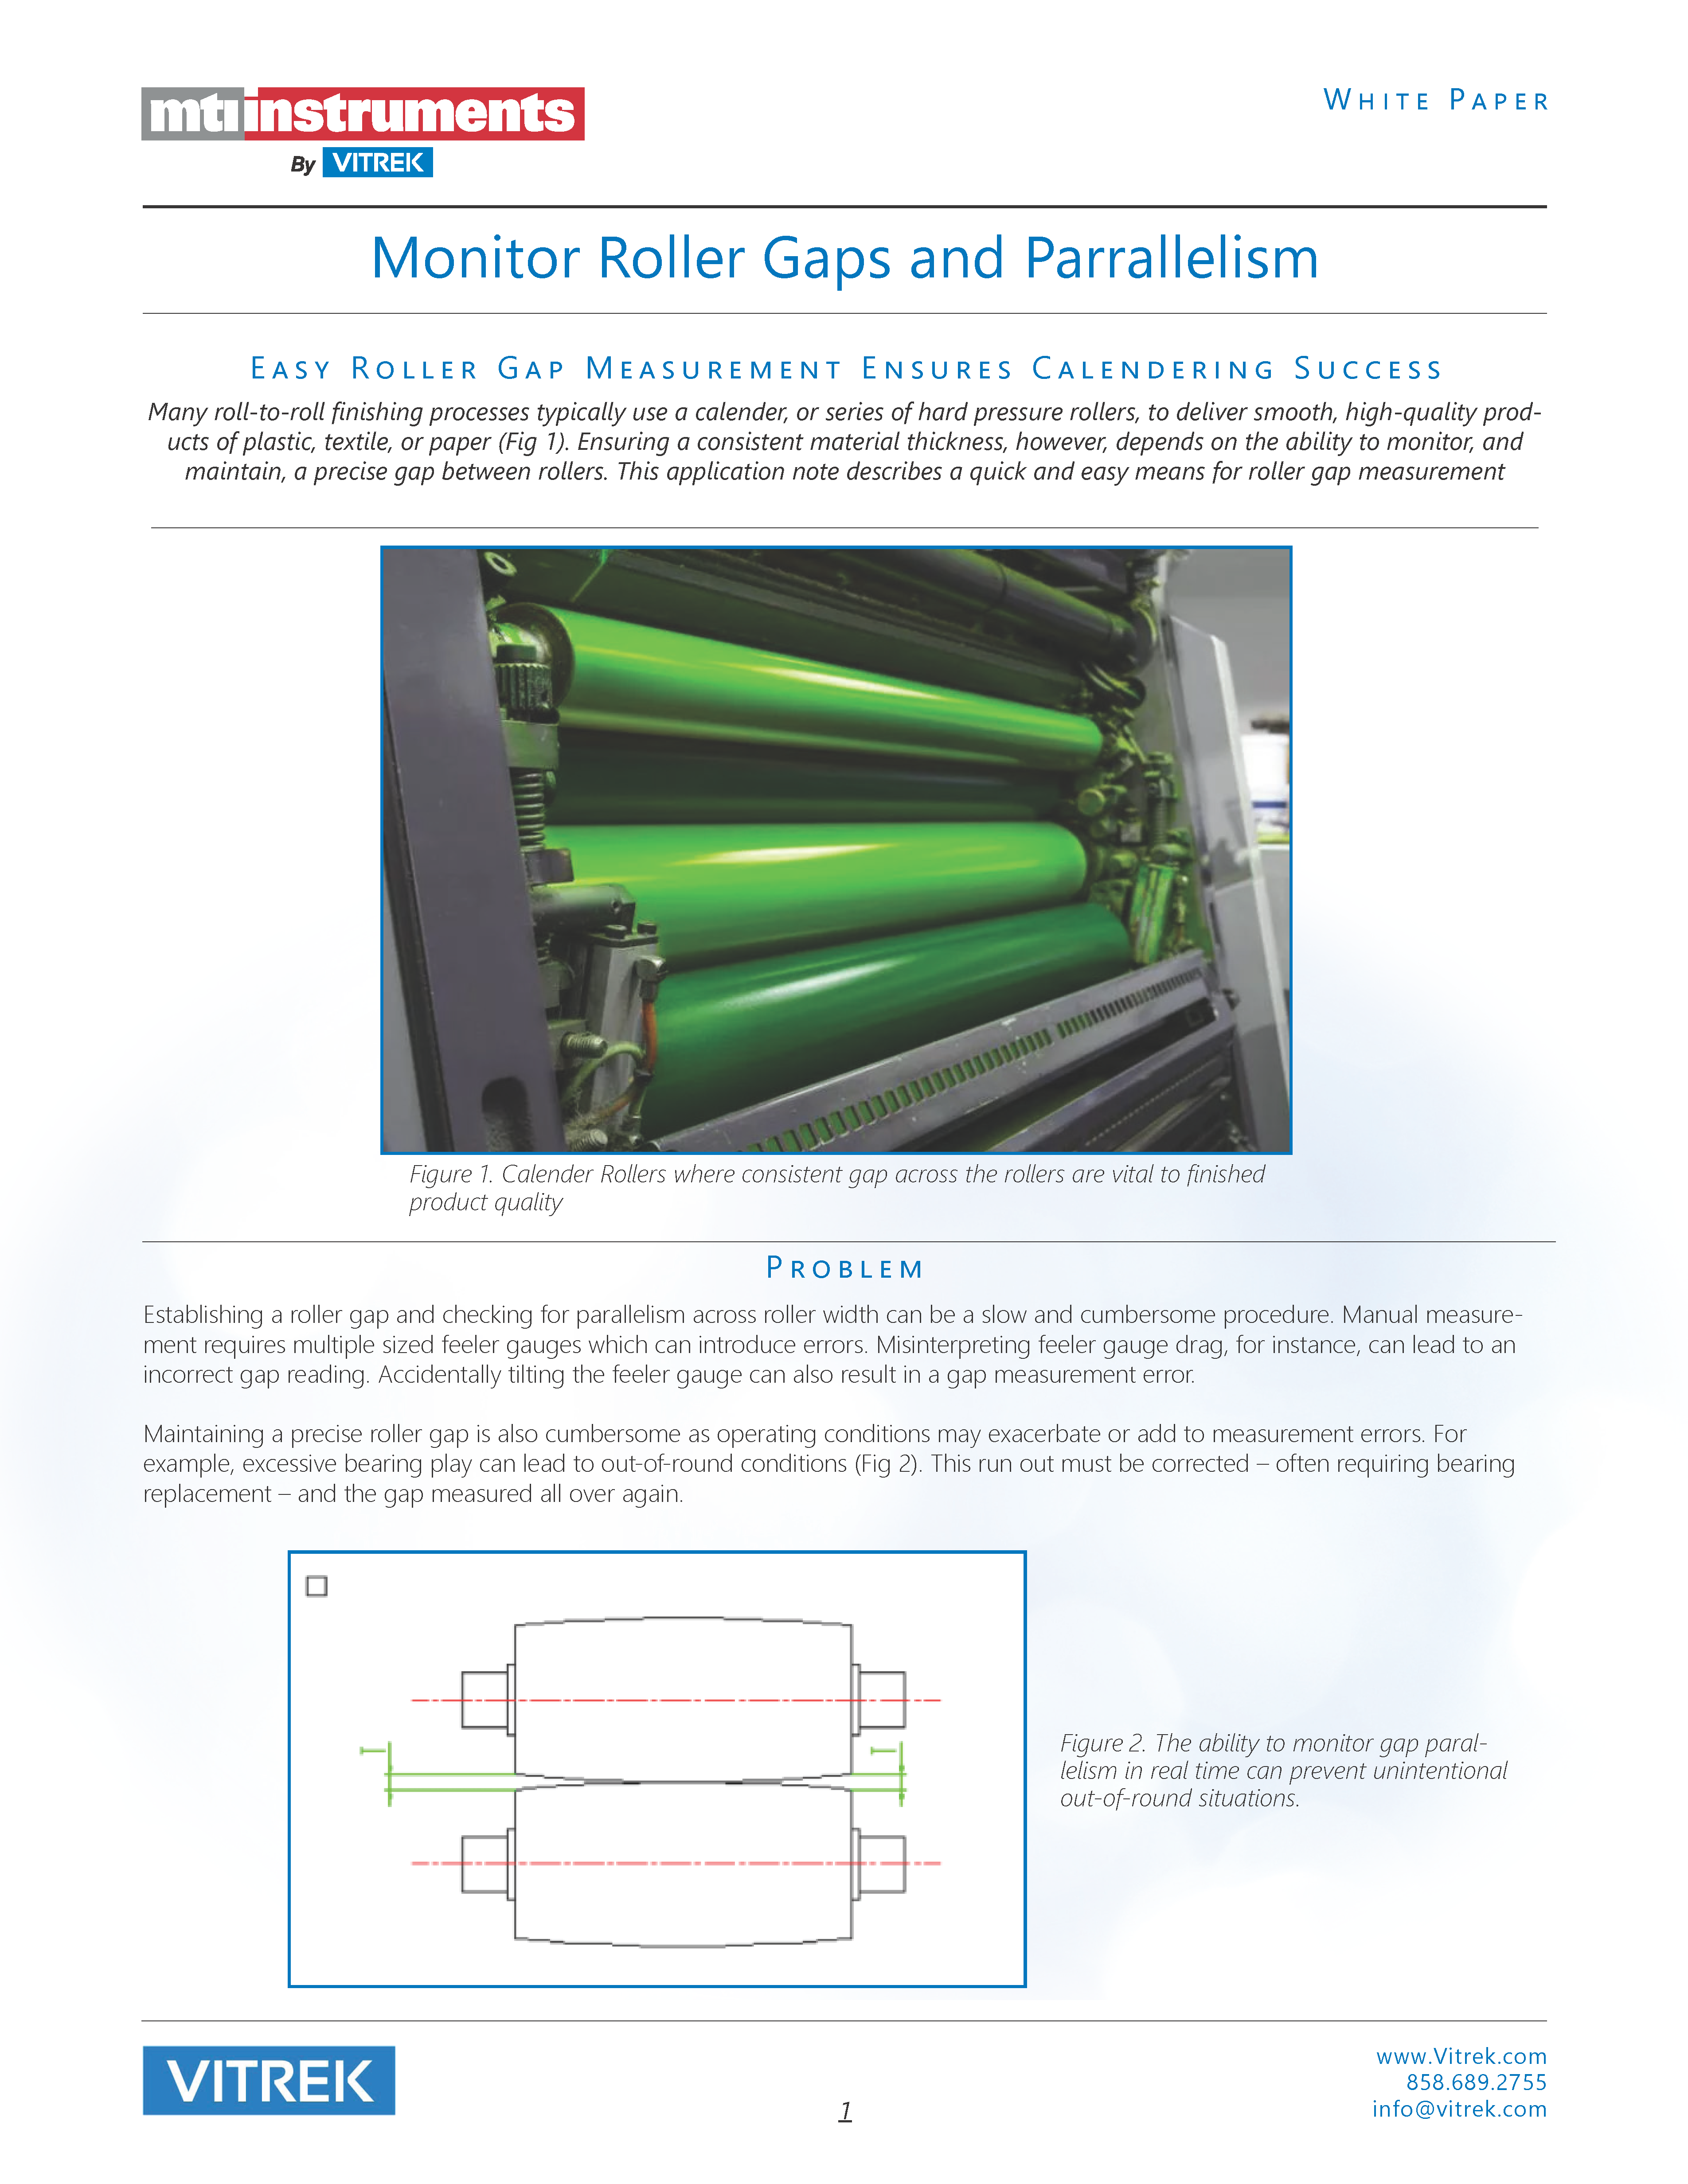 MTI Whitepaper: Easy Roller Gap Measurement Ensures Calendering Success Gallery
MTI Whitepaper: Easy Roller Gap Measurement Ensures Calendering Success
Brand-MTI, Industry-Consumer Products, Industry-Manufacturing, Industry-Sensors, News-MTI-Instrumentation, Products-MTI-Capacitance, Whitepapers-MTI, z1
 A Comprehensive Guide to Non-Contact Sensors and Their Applications Gallery
A Comprehensive Guide to Non-Contact Sensors and Their Applications
Application Notes-MTI, Articles-MTI, Brand-MTI, Industry-Sensors, News-MTI-Metrology, Products-MTI-Capacitance, Products-MTI-Laser/Fiber Optic, Products-MTI-Semiconductor/Metrology, Whitepapers-MTI, Z-REPUB, z1
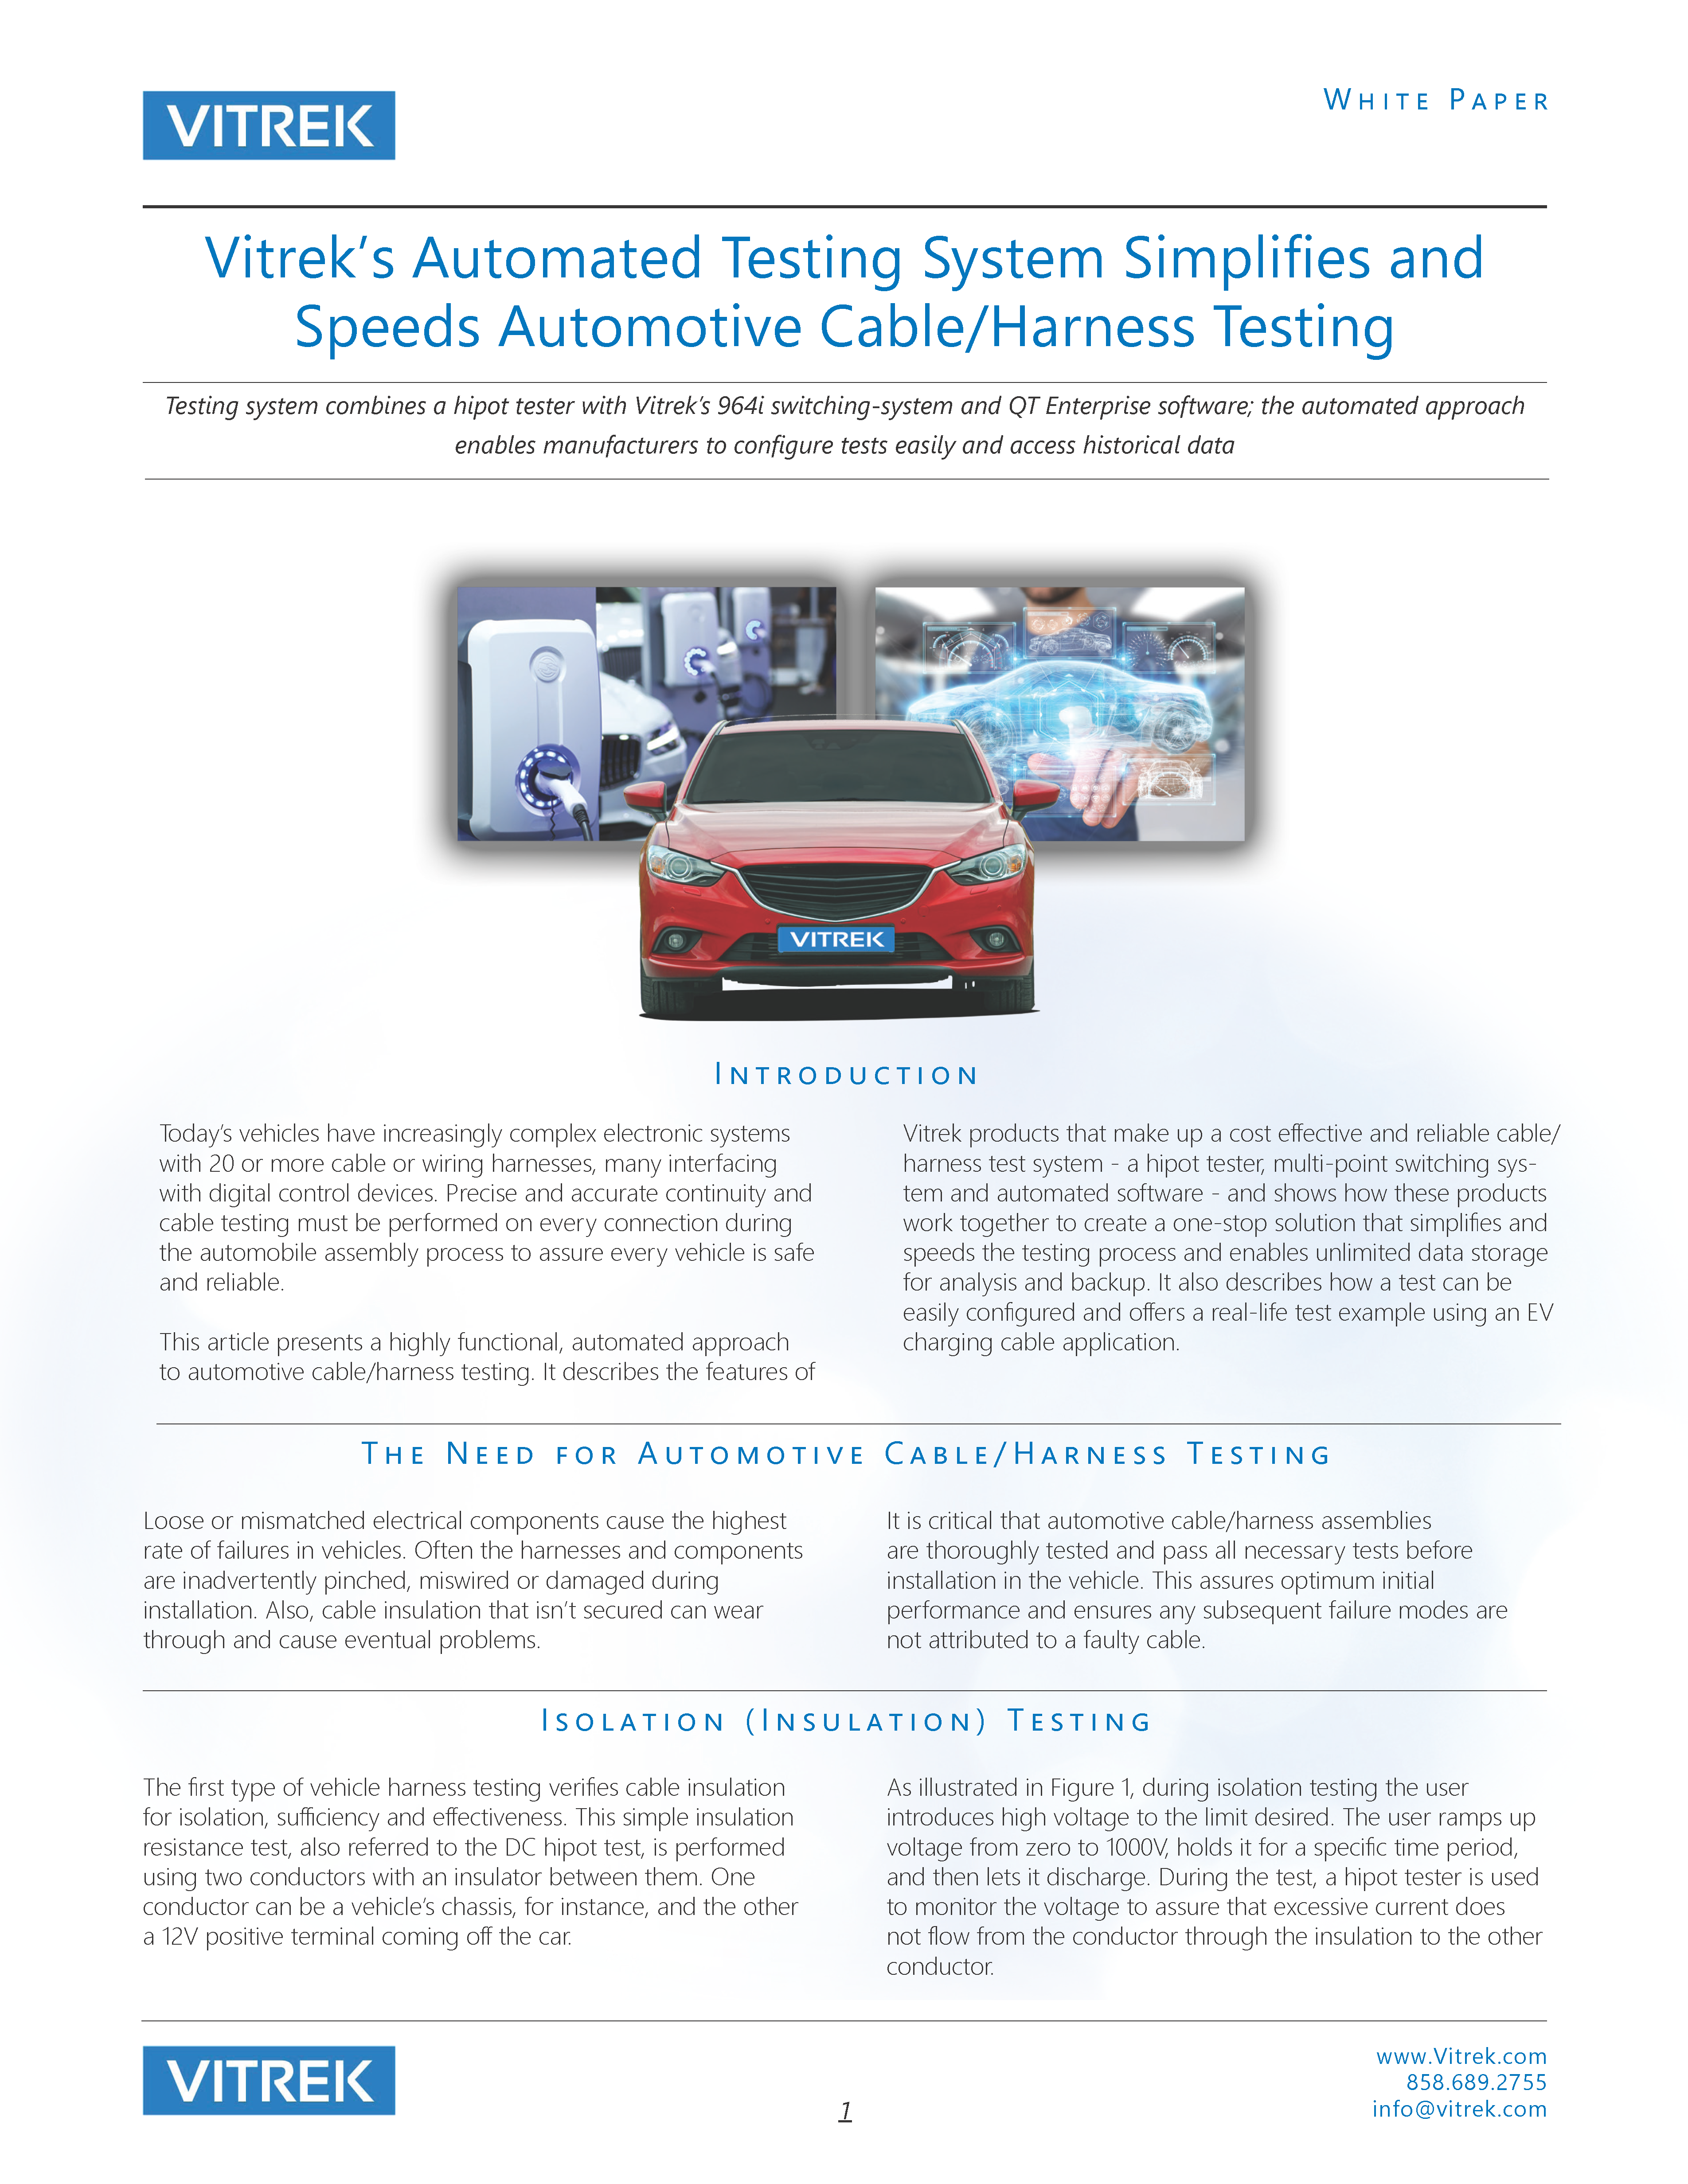 Vitrek’s Automated Testing System Simplifies and Speeds Automotive Cable/Harness Testing Gallery
Vitrek’s Automated Testing System Simplifies and Speeds Automotive Cable/Harness Testing
Application Notes-Vitrek, Brand-Vitrek, Industry-Automotive, Industry-Consumer Products, Industry-Government/Military, Industry: Transportation, Whitepapers, z1
 White Paper: High Performance Test Equipment Assures LED Lighting Products Comply with Industry Standards Gallery
White Paper: High Performance Test Equipment Assures LED Lighting Products Comply with Industry Standards
Brand-Vitrek, Industry-Consumer Products, Industry-Lighting, News-Industry, News-Vitrek, Products-Vitrek, Whitepapers-Vitrek, z1
 Aircraft Vibration Analysis and Measurement Techniques Gallery
Aircraft Vibration Analysis and Measurement Techniques
Brand-MTI, Industry-Aerospace, Industry-Compliance Testing, Industry-Government/Military, Industry-Manufacturing, Industry: Transportation, Knowledge Center-MTI, News-MTI-PBS, Whitepapers-MTI, Z-REPUB, z1



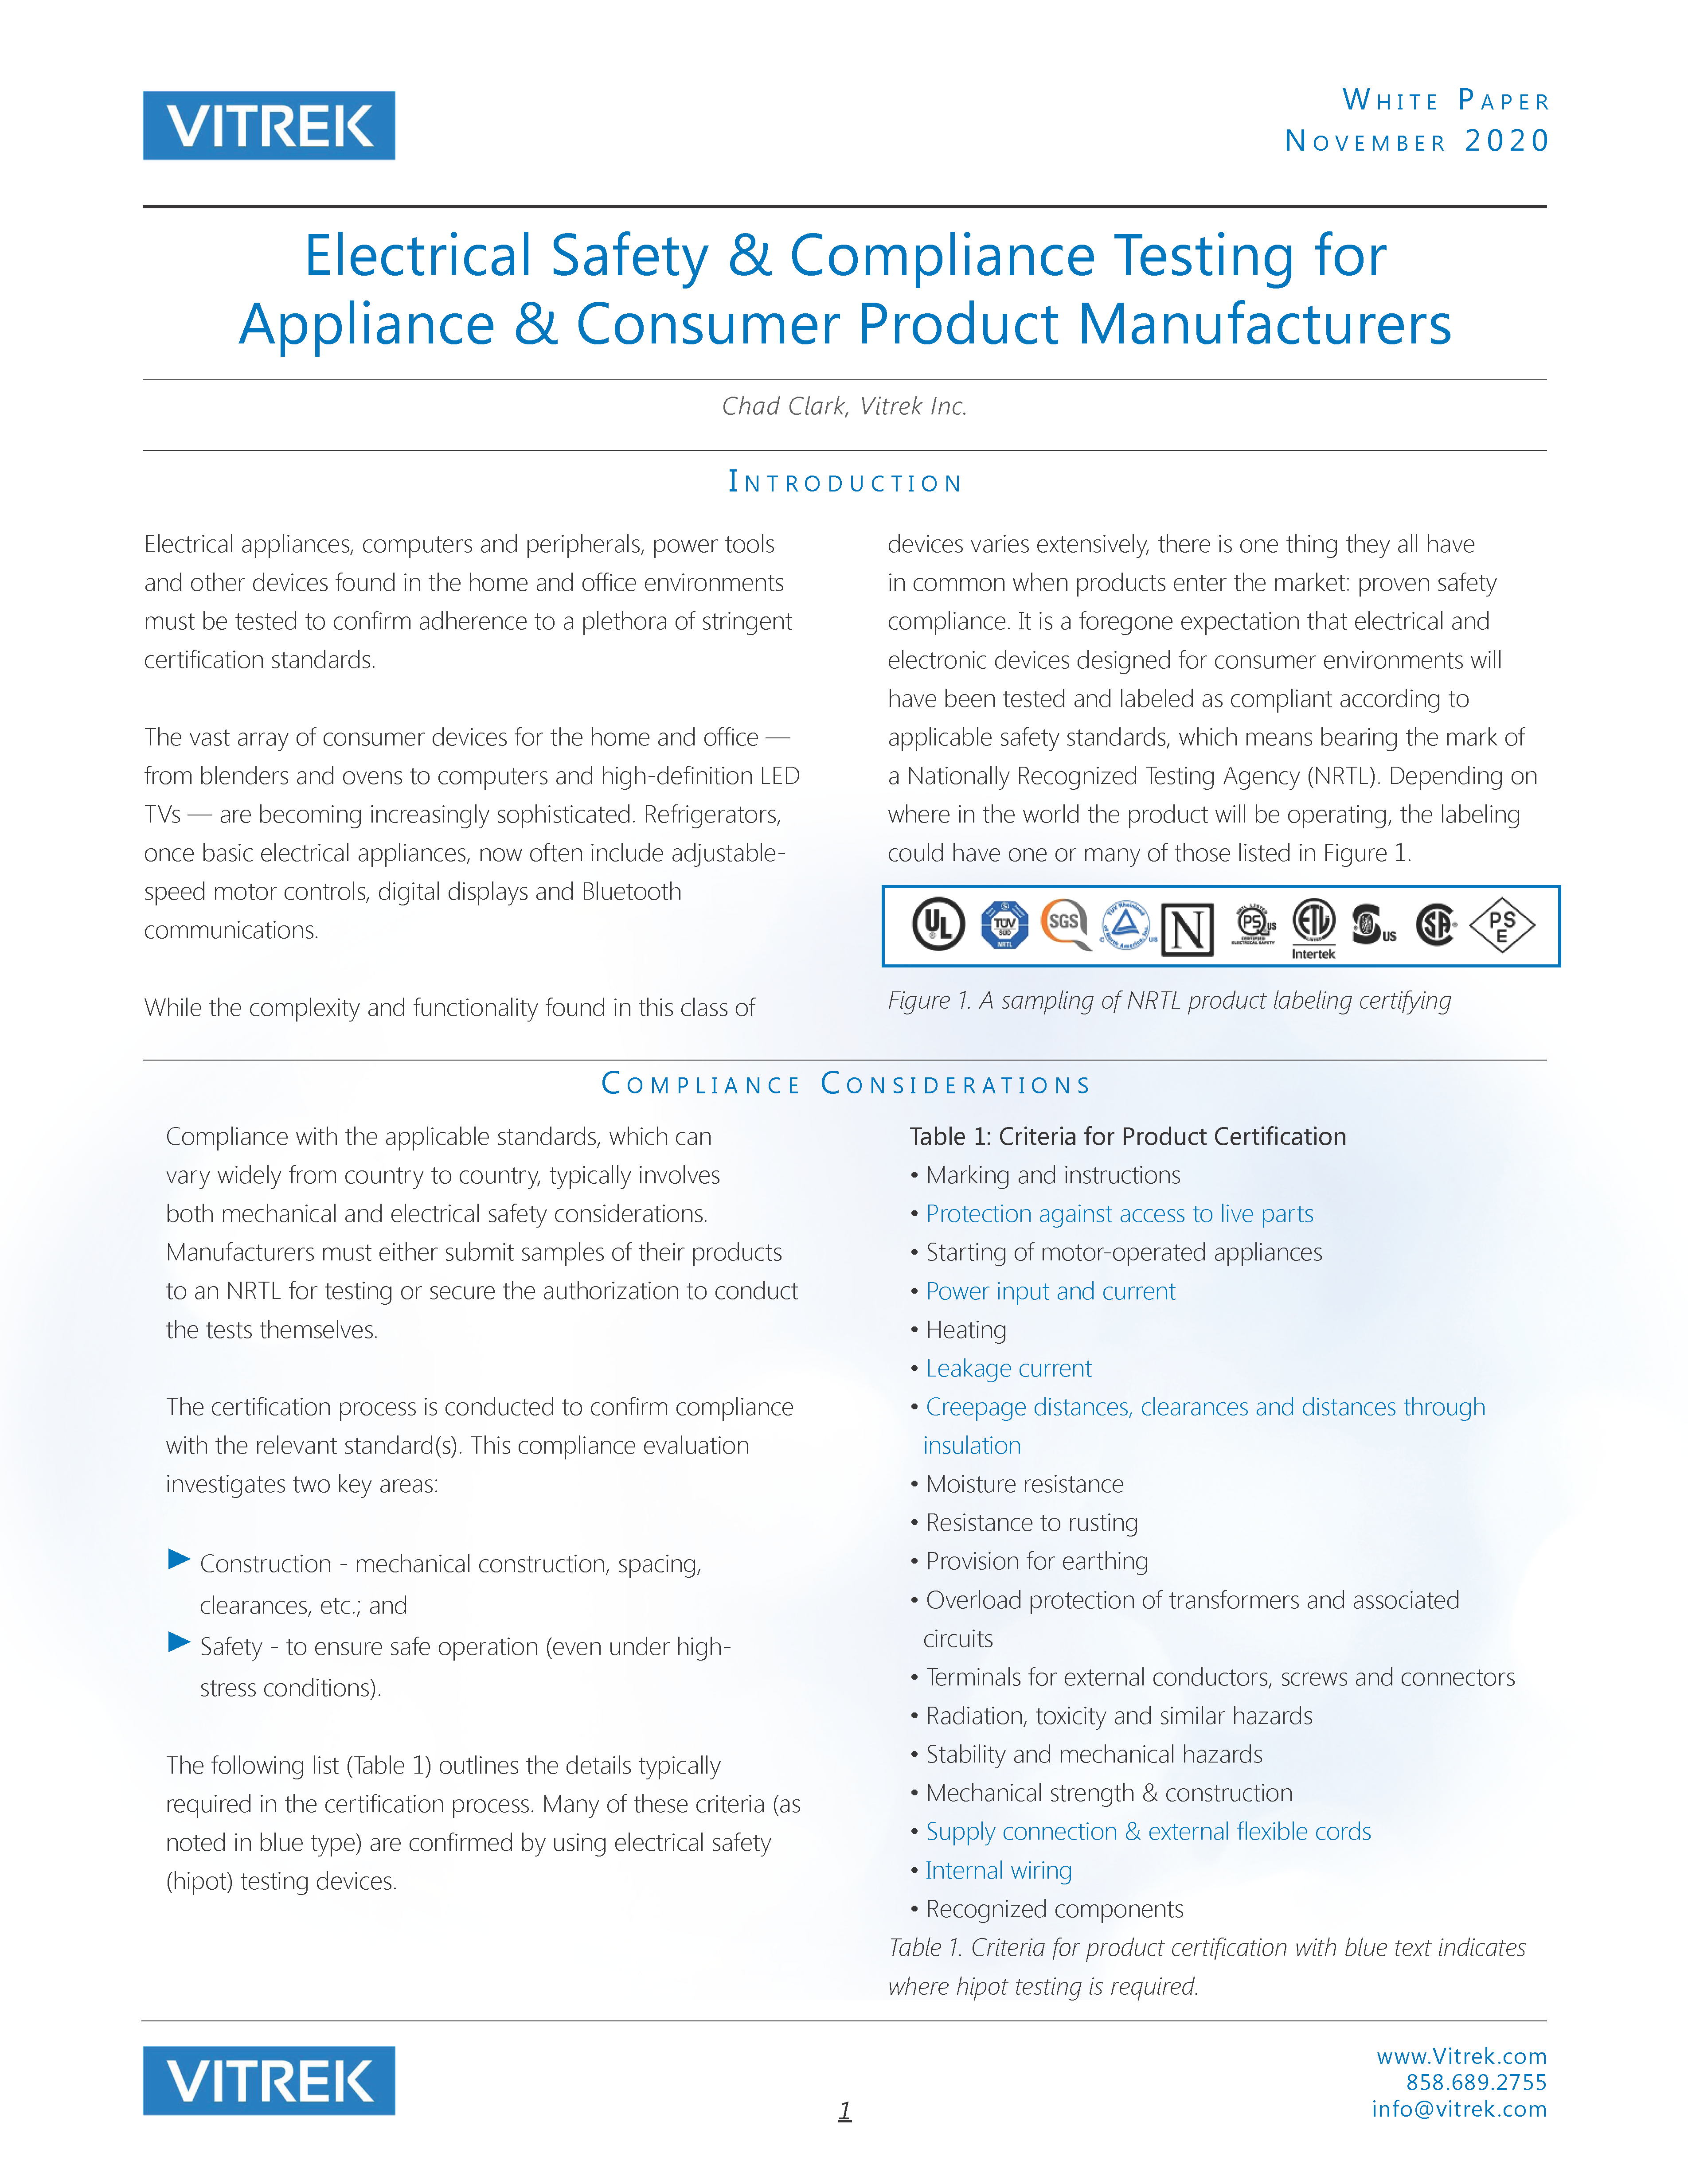 White Paper: Electrical Safety & Compliance Testing for Appliance & Consumer Product Manufacturers Gallery
White Paper: Electrical Safety & Compliance Testing for Appliance & Consumer Product Manufacturers
Brand-Vitrek, Industry-Compliance Testing, Industry-Consumer Products, Industry-Electronics, Industry-Manufacturing, News-Vitrek, Products-Vitrek, Whitepapers-Vitrek, z1
 White Paper: Cable & Connector Test System Facilitates Multi-Point High Voltage/Current Testing Gallery
White Paper: Cable & Connector Test System Facilitates Multi-Point High Voltage/Current Testing
Brand-Vitrek, Industry-Aerospace, Industry-Automotive, Industry-Cable Test, Industry-Compliance Testing, Industry-Consumer Products, Industry-Government/Military, Industry-Manufacturing, Industry: Transportation, Whitepapers-Vitrek
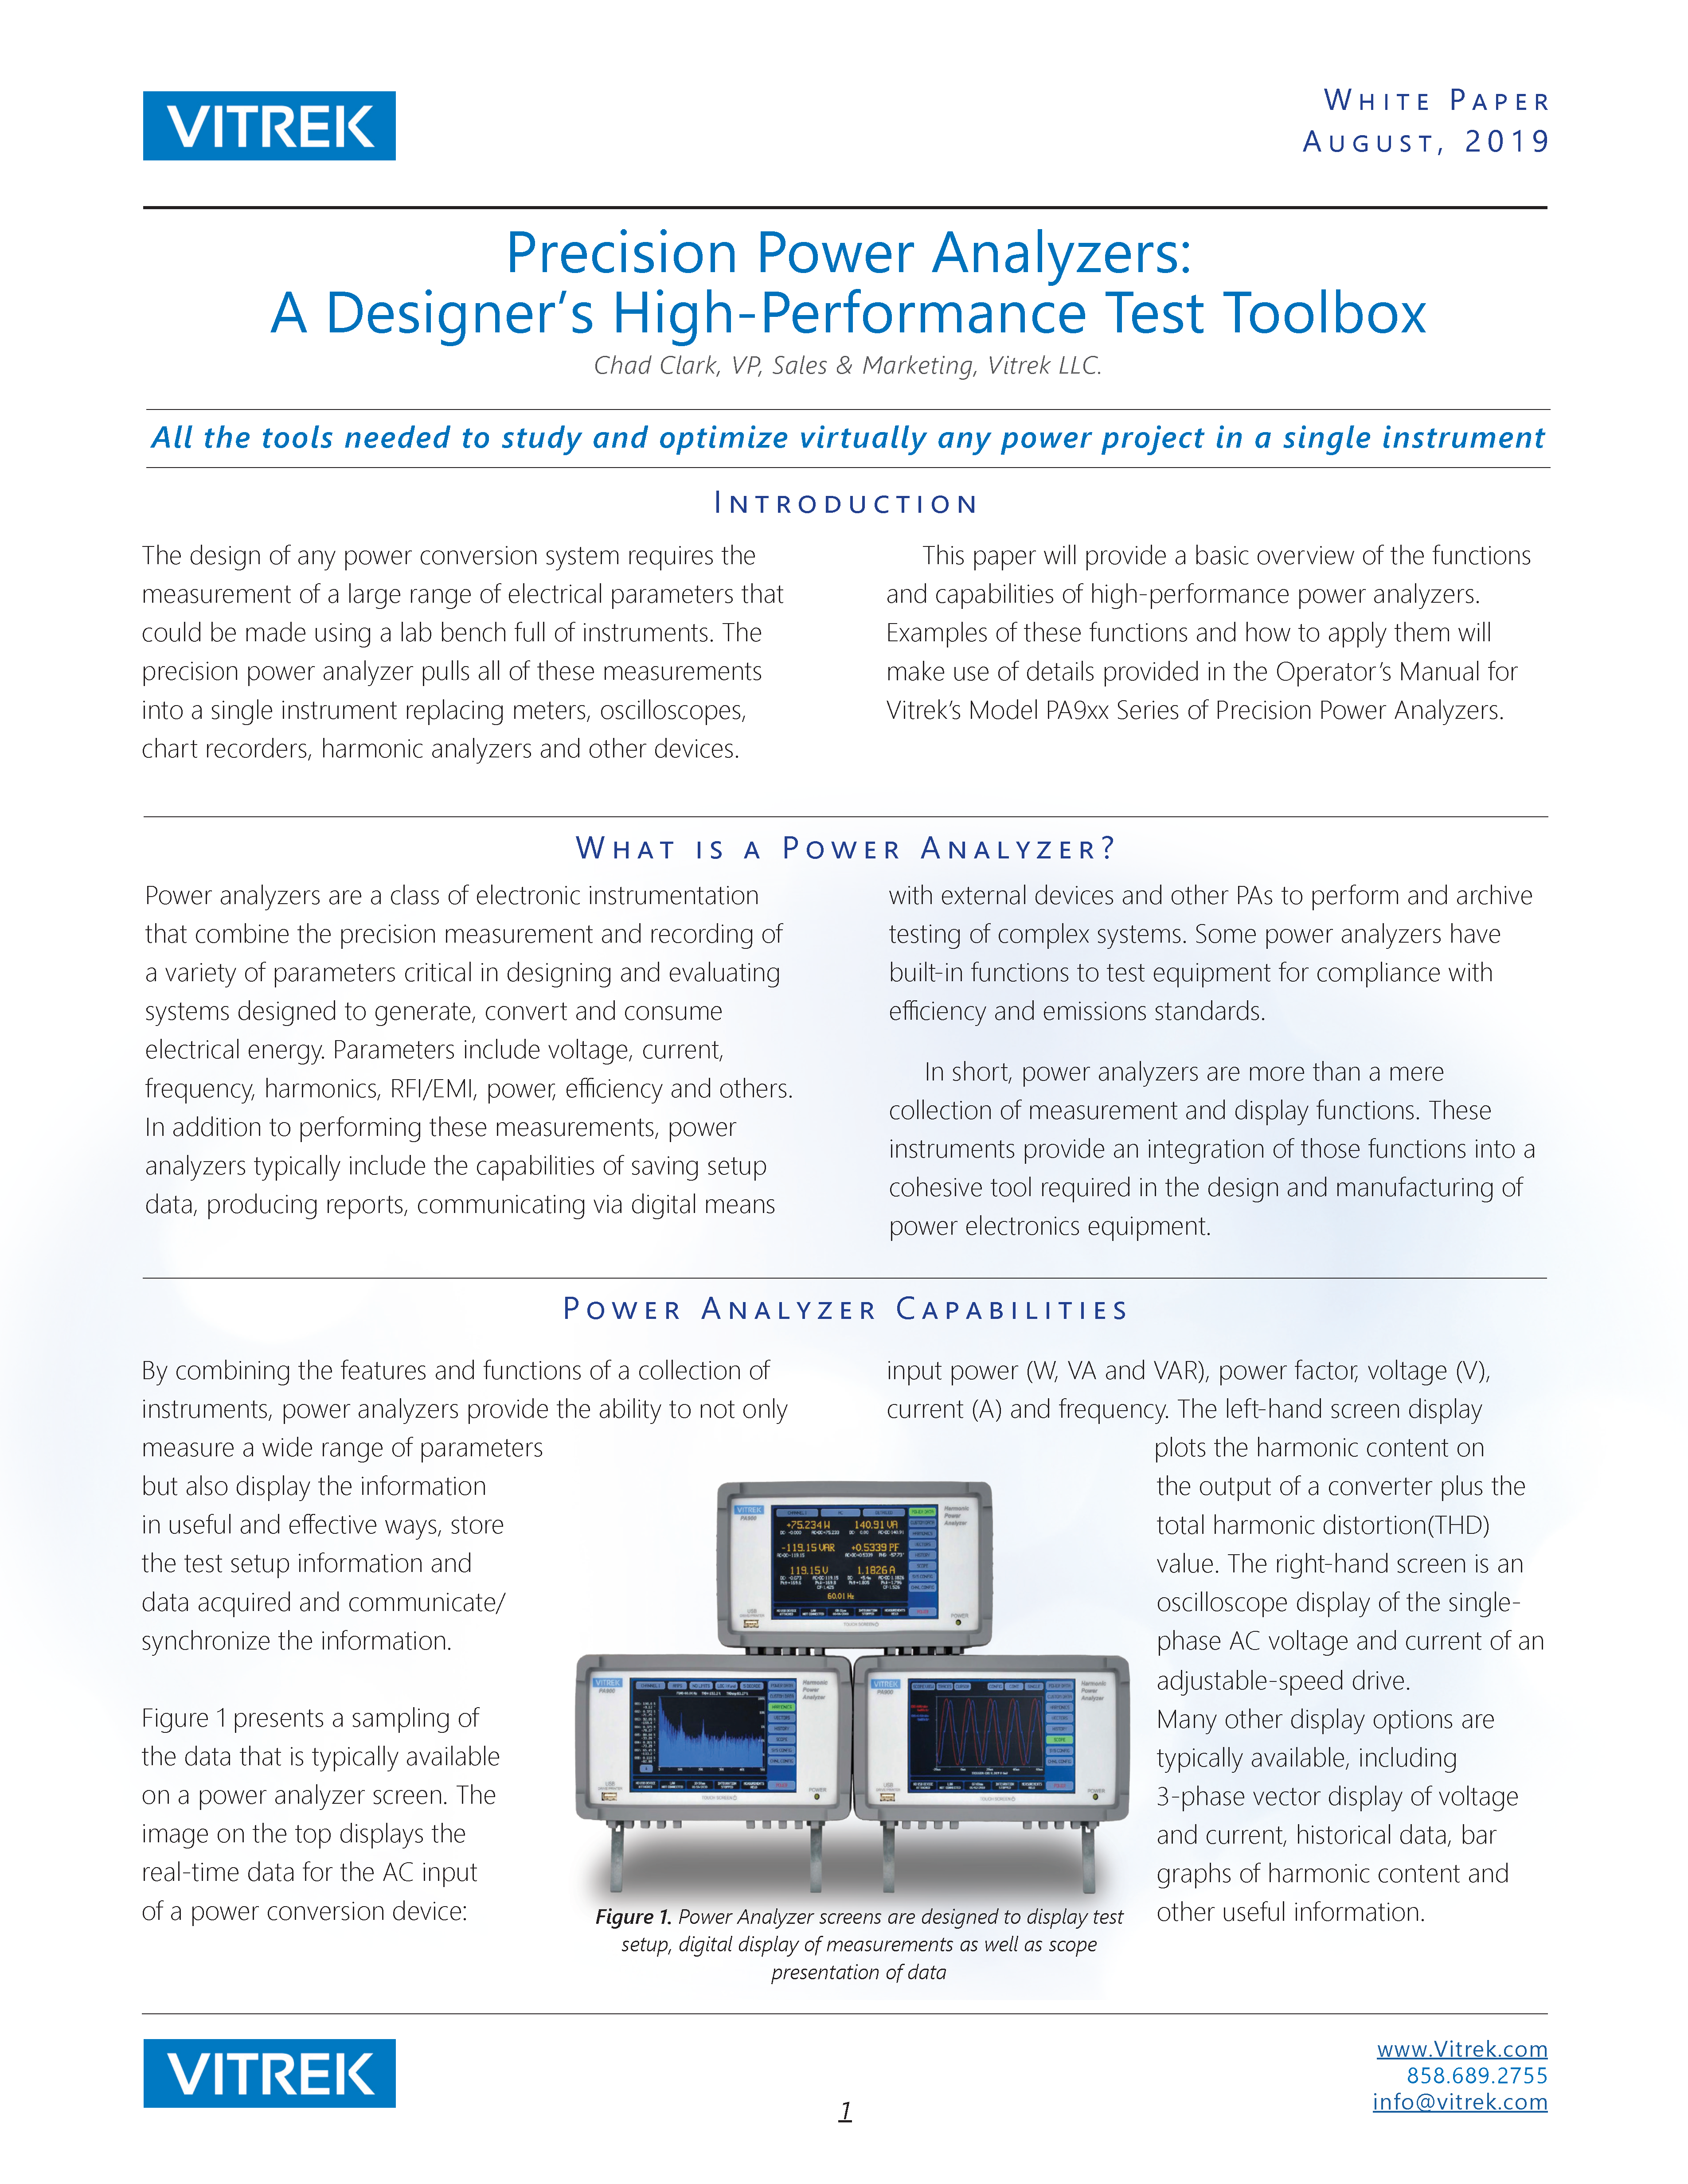 White Paper: Precision Power Analyzers Gallery
White Paper: Precision Power Analyzers
Brand-Vitrek, Industry-Compliance Testing, Industry-Consumer Products, Industry-Electronics, Industry-Energy, Industry-Manufacturing, Industry-R&D, News-Product Updates, News-Products, News-Vitrek, Products-Vitrek-Power-Analyzer, Whitepapers-Vitrek, z1
 Measuring Brake Rotor Thickness Variation with Capacitive Sensing Gallery
Measuring Brake Rotor Thickness Variation with Capacitive Sensing
Brand-MTI, Industry-Aerospace, Industry-Automotive, Industry-Consumer Products, Industry-Government/Military, Industry-Manufacturing, Industry: Transportation, Knowledge Center-MTI, Products-MTI-Capacitance, Whitepapers-MTI, Z-REPUB, z1



Articles
- Choosing the Right Hipot Platform for Modern Manufacturing Electrical Safety Testing Gallery
Choosing the Right Hipot Platform for Modern Manufacturing Electrical Safety Testing
Articles-Vitrek, Industry-Automotive, Industry-Battery, Industry-Cable Test, Industry-Compliance Testing, Industry-Consumer Products, Industry-Electronics, Industry-Government/Military, Industry-Lighting, Industry-Manufacturing, Industry-Medical, Industry-R&D, Knowledge Center-Vitrek, New & Press Releases, Whitepapers-Vitrek


- Case-In-Point: MTI Turbine Vibration Analyzer/Balancing System Technology Principles Gallery
Case-In-Point: MTI Turbine Vibration Analyzer/Balancing System Technology Principles
Application Notes-MTI, Articles-MTI, Industry-Aerospace, Industry-Compliance Testing, Industry-Government/Military, Industry: Transportation, Knowledge Center-MTI, News-Industry, News-MTI-PBS, Whitepapers-MTI
- Article: High-Performance Digitizers in Semiconductor Manufacturing Applications Gallery
Article: High-Performance Digitizers in Semiconductor Manufacturing Applications
Application Notes-GaGe, Articles-GaGe, Industry-Compliance Testing, Industry-Semiconductor, Industry-Semiconductor-GaGe, Knowledge Center-GaGe, News-GaGe, News-Industry, Whitepapers-GaGe

 Article: Advanced Test Equipment Enables LED Lighting Manufacturers to Ensure Compliance with Standards-August, 2022-Designing-Electronics.com Gallery
Article: Advanced Test Equipment Enables LED Lighting Manufacturers to Ensure Compliance with Standards-August, 2022-Designing-Electronics.com
Articles-Vitrek, Brand-Vitrek, Industry-Lighting, News-Vitrek, Products-Vitrek, Products-Vitrek-4700, Products-Vitrek-964i, Products-Vitrek-98x, Products-Vitrek-DL Load, Products-Vitrek-Hipot, Products-Vitrek-Power-Analyzer, Products-Vitrek-QT, z1
 Why You Need Automotive Cable Tests Before Cars Hit the Road Gallery
Why You Need Automotive Cable Tests Before Cars Hit the Road
Articles-Vitrek, Blog, Brand-Vitrek, Electrical Safety Testing Blog, Industry-Automotive, Industry-Cable Test, Industry-Compliance Testing, Industry-Government/Military, Industry-Manufacturing, Industry: Transportation, Products-Vitrek-964i, z1
- A Comprehensive Guide to Non-Contact Sensors and Their Applications Gallery
A Comprehensive Guide to Non-Contact Sensors and Their Applications
Application Notes-MTI, Articles-MTI, Brand-MTI, Industry-Sensors, News-MTI-Metrology, Products-MTI-Capacitance, Products-MTI-Laser/Fiber Optic, Products-MTI-Semiconductor/Metrology, Whitepapers-MTI, Z-REPUB, z1


 How Aircraft Operators Reduce Downtime While “Sweating the Assets” Gallery
How Aircraft Operators Reduce Downtime While “Sweating the Assets”
Articles-MTI, Brand-MTI, Industry-Aerospace, Industry-Compliance Testing, Industry-Government/Military, Industry-Manufacturing, Industry: Transportation, News-MTI-PBS, Products-MTI-Engine Balancing, Z-REPUB, z1





Vitrek in the News…
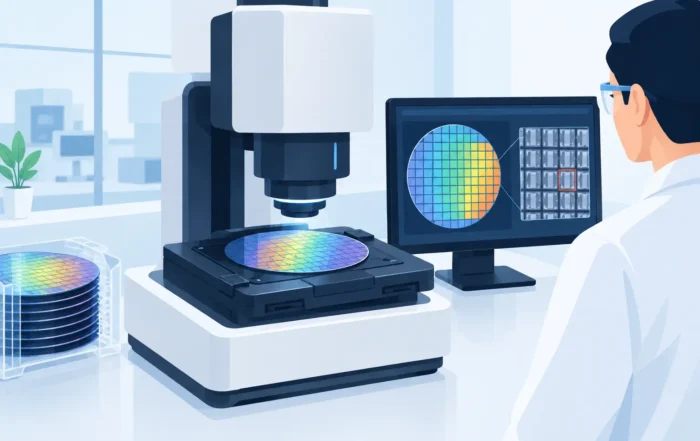
How to Select the Best Wafer Inspection Tools
A wafer inspection platform can appear highly capable in a demonstration and still be the wrong instrument for a production line. The best wafer inspection tools are not defined by maximum resolution alone. They are defined by whether they detect the defects that matter, at a sampling rate and throughput that support a usable process-control decision.
For semiconductor engineering teams, the selection process starts with the failure mechanism, not the instrument brochure. A tool intended to monitor incoming bare wafers has a different optical, handling, and data requirement than a system used to identify pattern defects after lithography, inspect backside contamination, or characterize wafer geometry before bonding. Clear requirements protect capital budgets and reduce the risk of collecting large volumes of data that do not improve yield.
What the Best Wafer Inspection Tools Must Deliver
Inspection is often discussed as if it were a single measurement task. In practice, it includes several distinct functions: locating surface defects, identifying particles and contamination, detecting pattern anomalies, examining edge and backside conditions, and providing dimensional or geometric information that affects downstream processing.
The right system must deliver meaningful sensitivity without creating an unmanageable nuisance-defect burden. A tool that flags every benign process variation can consume review capacity and obscure the defects associated with yield loss. Conversely, a high-throughput system that misses the defect population of interest may provide false confidence.
Engineers should define acceptance criteria in measurable terms. These commonly include minimum detectable defect size, defect capture rate, false-alarm rate, wafer coverage, image quality, repeatability, and cycle time. Each metric should be tied to a specific decision: release a wafer lot, adjust a process module, trigger maintenance, quarantine material, or conduct failure analysis.
Sensitivity and throughput are an engineering trade-off
Higher sensitivity often requires more image acquisition, tighter focus control, slower stage motion, or additional optical channels. Those requirements can reduce wafers per hour. This is not inherently a problem in an R&D lab or low-volume failure-analysis workflow, where information quality is the priority. It becomes a significant constraint in high-volume manufacturing, where delayed feedback can allow a process excursion to affect many wafers.
The useful question is not, “What is the smallest defect this tool can see?” It is, “What defect size and type must be detected at the required confidence level on this layer, at this production rate?” That distinction prevents teams from paying for sensitivity that does not change an operational decision.
Defect detection is not defect classification
Many inspection systems can identify a signal that differs from the expected wafer surface or pattern. Fewer systems can reliably classify that signal as a particle, scratch, pit, residue, pattern bridge, missing feature, edge chip, or another defect class without review.
Classification quality matters because corrective action depends on defect source. Random particles may point to contamination control or handling. Repeating pattern defects may indicate an exposure, mask, deposition, etch, or CMP issue. Spatial signatures such as center-to-edge variation, radial rings, or recurring die locations can be as valuable as the individual defect image.
Evaluate how the tool records location, size, intensity, morphology, and classification confidence. The data structure should support wafer maps, lot-to-lot comparisons, excursion analysis, and traceability to the process step. A high-quality image without usable contextual data has limited value in a controlled manufacturing environment.
Match the Inspection Method to the Wafer and Process Step
Optical inspection remains a practical choice for many wafer applications because it supports non-contact measurement and can provide useful speed across large areas. Brightfield methods are effective for many surface and pattern inspection tasks. Darkfield methods can improve contrast for scattering defects such as particles, scratches, and certain surface irregularities. The appropriate illumination geometry depends on the defect mechanism, surface finish, film stack, and pattern complexity.
For transparent, multilayer, highly reflective, or otherwise challenging materials, a standard visible-light configuration may not provide enough contrast or depth discrimination. Applications may require multiple wavelengths, polarization control, infrared imaging, confocal techniques, or other specialized approaches. The objective is not to select the most complex optical architecture. It is to establish sufficient contrast between a critical defect and its background under production conditions.
Bare wafers require different capabilities than patterned wafers
Bare-wafer inspection commonly focuses on particles, haze, scratches, pits, slip, edge damage, backside contamination, and surface quality. These tasks may require broad area coverage and strong repeatability for incoming material qualification or process monitoring.
Patterned-wafer inspection introduces die-to-die and cell-to-cell comparison, design-rule context, pattern noise, and layer-specific sensitivity requirements. A signal that is obvious on a polished bare wafer can be difficult to separate from a dense patterned background. Patterned-wafer workflows also place greater emphasis on coordinate accuracy and review integration because defect locations must be correlated with die, reticle field, and process history.
Do not assume that a platform optimized for unpatterned wafer surface defects will provide the required performance on advanced patterned layers. Similarly, a high-complexity patterned-wafer system can be inefficient for routine incoming bare-wafer screening.
Consider edge, backside, and geometry as separate requirements
Yield-affecting defects are not limited to the front side. Edge chips, microcracks, bevel contamination, and backside particles can affect handling, lithography focus, bonding, chucking, and device reliability. These conditions may require dedicated viewing angles, wafer rotation, or handling configurations that are not part of a standard front-side scan.
Geometric measurements such as bow, warp, thickness variation, flatness, and surface topography also belong in the broader wafer quality strategy. They are metrology tasks rather than defect inspection tasks, although the process-control decisions often overlap. When a process requires both, evaluate whether the systems can share wafer identification, recipes, maps, and manufacturing data. Integrating results is often more valuable than forcing one instrument to perform every measurement.
Evaluate the Measurement System, Not Only the Sensor
A technically sound inspection tool includes more than optics and image processing. Wafer handling, stage accuracy, focus control, recipe management, calibration approach, software architecture, and serviceability all influence measurement integrity.
For critical applications, verify repeatability using representative wafers and known defect standards where available. Testing should include realistic surface conditions, process films, wafer sizes, and defect distributions. Vendor demonstrations using ideal samples are useful, but they do not replace an application-specific evaluation.
Ask how the tool maintains positional accuracy across the wafer, how it manages focus on warped substrates, and how often calibration or verification is required. Understand whether performance specifications apply at the wafer center only or across the full usable scan area. Also establish the environmental requirements for vibration, temperature stability, cleanliness, and operator interaction. A measurement system that performs well in a controlled laboratory may need additional controls before deployment near production equipment.
Data Integration Determines Process Value
Inspection data must move from image capture to action. The most effective systems support consistent wafer and lot identification, recipe version control, defect maps, exportable results, and traceable audit records. For automated environments, consider the availability of software interfaces, data formats, factory automation compatibility, and the ability to connect results to manufacturing execution systems or statistical process-control workflows.
Data integrity deserves the same attention as optical sensitivity. If operators can change recipes without controls, if defect thresholds are not recorded, or if lot data cannot be traced to a calibration state, the resulting information may be difficult to defend during quality investigations or customer audits.
A practical evaluation should also account for review workflow. Determine who will review flagged defects, how images will be prioritized, and what criteria will trigger engineering action. Inspection capacity is not simply wafers per hour. It is the combined capacity of scanning, review, classification, disposition, and feedback to the process owner.
Build a Selection Specification Before Requesting Quotes
A concise specification gives suppliers a fair basis for proposing a system and gives internal stakeholders a way to compare alternatives. Include the wafer materials, diameters, thickness range, front-side and backside conditions, target defect types, required detection threshold, coverage area, throughput, automation level, data outputs, facility constraints, and calibration expectations.
It is also useful to separate mandatory requirements from desirable capabilities. A facility may need 100 percent backside coverage and lot traceability, while automated classification of every nuisance particle may be desirable but not essential. This distinction helps prevent scope growth and keeps the evaluation focused on yield and compliance risk.
For organizations that require inspection alongside precision geometric measurement, electrical test, or broader manufacturing diagnostics, the supplier’s application knowledge and support model should be evaluated as carefully as the instrument specification. Long-term performance depends on training, method development, calibration traceability, spare-part availability, and the ability to adapt recipes as processes change.
The strongest wafer inspection decision is usually the one that makes the next engineering action clearer. Specify the defects that matter, validate detection on representative wafers, and select a measurement architecture that can sustain the required feedback loop as production and device complexity evolve.
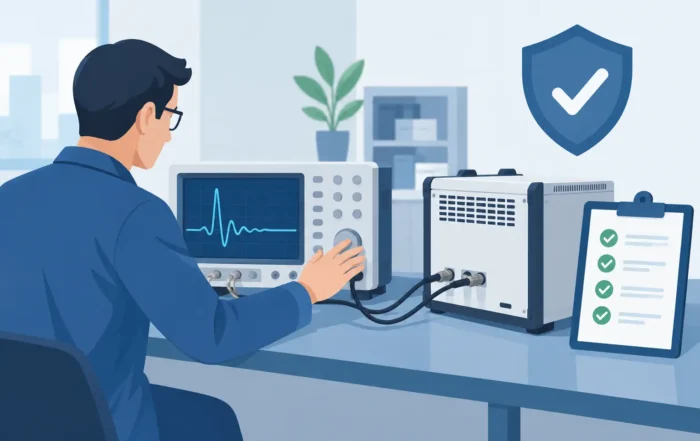
How to Validate Surge Testing Equipment Properly
A surge tester can produce a voltage reading that appears correct while delivering a waveform that is unsuitable for detecting turn-to-turn insulation weaknesses. To validate surge testing equipment, engineers must verify the complete test function: generated pulse, measurement path, safety controls, fixture behavior, and recorded result. That distinction matters when test data supports production release, design qualification, or a compliance record.
Surge testing applies a fast, high-voltage impulse to windings, coils, transformers, motors, and similar inductive components. The resulting oscillatory waveform can reveal insulation defects that may not appear during DC hipot or insulation resistance testing. Because the test depends on transient behavior, validation requires more than confirming a peak-voltage display.
What Validation Must Establish
Calibration and validation serve related but different purposes. Calibration confirms that a defined instrument parameter agrees with a traceable reference within stated uncertainty. Validation demonstrates that the equipment, test setup, and operating method are fit for the intended application.
For a surge test system, that intended use might be comparing phase-to-phase motor winding signatures on an EV stator line, screening transformer coils after winding, or investigating suspected interturn faults during engineering analysis. Each application can require a different voltage range, pulse rate, waveform comparison method, and decision limit.
A technically defensible validation establishes that the system can repeatedly generate the specified stimulus, capture the relevant response without materially distorting it, and reliably classify acceptable and unacceptable parts according to documented criteria. It should also show that the operator cannot easily bypass safety functions or apply the wrong test program.
Define the Required Surge Test Before You Measure
Validation starts with a written test requirement, not an instrument menu. Define the component type, winding configuration, maximum test voltage, expected inductance range, test leads, fixtures, pulse count, and pass/fail method. Include the governing customer specification, internal work instruction, or applicable industry standard where one applies.
The required waveform characteristics should be explicit. Peak voltage alone is rarely sufficient. Depending on the product and failure mechanism, the relevant characteristics may include rise time, pulse repetition rate, ringing frequency, decay envelope, polarity, and the timing of waveform acquisition. A low-inductance winding and a large motor stator will not present the same load to the surge source.
This is also where acceptance limits must be separated from equipment tolerances. A product requirement may allow only a small change in waveform frequency or an extremely tight signature comparison window. The tester, measurement chain, leads, and fixture must have enough margin that their combined uncertainty does not consume the decision threshold.
Verify the Surge Generator and Measurement Path
Use measurement equipment appropriate for fast, high-voltage pulses. A traceably calibrated high-voltage divider, differential probe, or specialized impulse measurement system must have voltage, bandwidth, and transient response characteristics suitable for the test waveform. An ordinary probe may be adequate for a preliminary check but inadequate for final validation if its bandwidth, compensation, insulation rating, or loading changes the observed waveform.
Measure the tester output at the point that most closely represents the device connection. First confirm performance into a defined reference load, then repeat the measurement with the production leads and fixture installed. This approach separates generator performance from effects introduced by the application hardware.
At minimum, compare commanded and measured peak voltage across the operating range used in production. Check repeatability at representative low, nominal, and maximum settings. Then assess the waveform shape. A tester may meet its voltage accuracy specification while exhibiting an unexpected change in rise time, ringing frequency, or decay due to a damaged output stage, an unsuitable cable, or an incorrect setup.
The acquisition system deserves equal attention. Verify that sampling rate, analog bandwidth, trigger position, record length, and vertical scaling preserve the waveform features used for pass/fail decisions. If the system compares a new waveform against a stored reference, verify that reference creation, normalization, alignment, and tolerance settings are controlled. A comparison algorithm cannot compensate for a reference trace captured with poor connections or an unstable fixture.
Account for Leads, Fixtures, and Stray Parameters
Surge testing is sensitive to the electrical behavior of the connection path. Lead length, routing, clip condition, fixture contacts, shielding, and grounding can affect the measured waveform. Parasitic inductance and capacitance may be small in a DC test but significant during a fast impulse.
Validate the actual production configuration whenever possible. If a fixture is changed, cables are replaced, or a new product family is introduced, determine whether partial or full revalidation is required. A controlled baseline waveform from a known-good reference part is valuable for detecting drift in the total system, but it should not replace traceable instrument verification.
Prove Repeatability and Fault Discrimination
A valid surge test must do more than produce stable traces on a known-good part. It must distinguish relevant defects from normal product variation. That calls for a structured study using representative samples.
Begin with a population of conforming units that covers expected variation in winding resistance, inductance, manufacturing lot, and operating temperature where relevant. Run repeated tests to characterize normal waveform variation. Then evaluate known defective samples, engineered fault samples, or approved surrogate networks that represent the defect mechanisms the test is intended to detect.
The goal is to demonstrate separation between acceptable and unacceptable responses with practical margin. If the response populations overlap, tightening the comparison limit may increase false failures, while loosening it may allow defective units through. The right answer may be a revised fixture, a different test voltage, a more appropriate waveform metric, or an additional test method rather than an arbitrary limit adjustment.
When production throughput matters, include pulse-to-pulse and unit-to-unit repeatability at the planned test rate. Thermal effects, relay wear, connection degradation, and automated handling can alter results over a shift even when a short bench check looks satisfactory.
Verify Safety and Control Functions
High-voltage transient testing requires validation of protective functions as well as measurement performance. Document tests of the safety enclosure, interlocks, emergency stop, operator start controls, warning indicators, discharge function, and access controls. Confirm that stored energy is reduced to a safe state after a test, an aborted cycle, and a loss of power.
Also verify software and configuration controls. The correct test program should be selected by part number, barcode, recipe control, or another documented method. Review whether voltage limits, pass/fail thresholds, user permissions, and calibration status can be changed without authorization. In regulated or high-consequence manufacturing, electronic records and audit trails may be part of the validation scope.
Four records provide a practical validation package:
- The approved test requirement and acceptance criteria.
- Traceable calibration certificates and measurement setup details.
- Raw waveforms, repeatability results, and fault-discrimination evidence.
- Approval records, safety checks, and defined revalidation triggers.
Set Revalidation Intervals Based on Risk
A fixed annual interval is common, but it is not a complete strategy. Revalidation frequency should reflect equipment utilization, voltage level, environmental conditions, maintenance history, product risk, and the consequences of an escaped defect. Calibration intervals for the surge tester and reference measurement equipment should be managed separately from process validation reviews.
Define event-based triggers as well. Revalidate after repair, firmware changes affecting waveform generation or analysis, replacement of major output components, fixture redesign, cable changes, relocation, or a meaningful change in product design. A failed daily verification or unusual waveform trend should initiate investigation before production continues.
A short routine check using a controlled reference artifact can provide early warning between formal validations. The artifact should be stable, clearly identified, protected from damage, and measured using the same connection method used in normal operation. Trend its key waveform attributes rather than relying only on a pass indication.
Use Validation Data to Improve the Test Process
The most useful validation records do not sit in a compliance folder. They reveal whether a surge test has enough measurement margin, whether fixtures are introducing unnecessary variation, and whether maintenance can be planned before test quality degrades. For high-voltage test systems, application-specific measurement capability and calibration support can help maintain that discipline across both laboratory and production environments.
A well-validated surge test provides confidence in more than a displayed voltage value. It establishes that the impulse reaching the winding, the waveform being analyzed, and the decision recorded for each unit are all credible enough to support the engineering decision that follows.
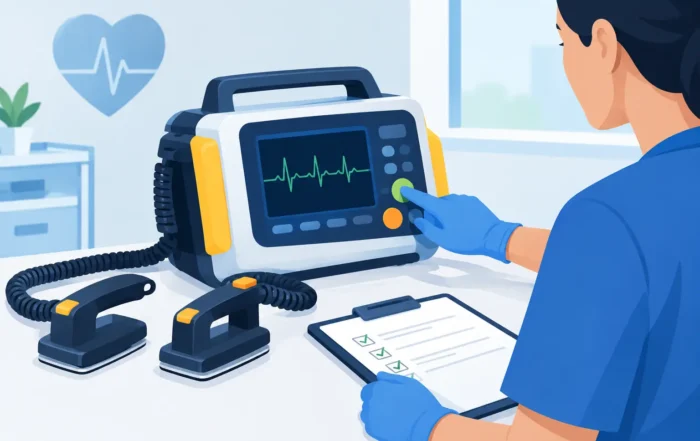
Medical Defibrillator Safety Test Requirements
A defibrillator can pass a basic power-on check and still present an unacceptable risk. Its safety depends on more than stored energy and a visible ECG trace: patient-connected circuits, high-voltage output paths, protective earth integrity, enclosure insulation, controls, and accessories must perform predictably under defined conditions. A medical defibrillator safety test therefore needs to separate electrical safety verification from energy-delivery performance while preserving traceable evidence for design validation, production release, or service.
The test plan should start with the device’s intended use and applicable standards, not with a generic analyzer sequence. An external manual defibrillator, AED, wearable defibrillator, and integrated defibrillation function in a patient monitor can have materially different requirements, accessories, applied-part classifications, and operating modes.
Define the Medical Defibrillator Safety Test Scope
For defibrillators, IEC 60601-1 provides the general framework for basic safety and essential performance, while IEC 60601-2-4 addresses particular requirements for cardiac defibrillators. Other standards and regulatory expectations may apply depending on the product configuration, market, and whether the work is design verification, production testing, incoming inspection, preventive maintenance, or post-repair evaluation.
That distinction matters. Type testing establishes that a design meets requirements under specified worst-case conditions. Production testing confirms that each manufactured unit has been assembled correctly and that no safety-critical defect was introduced. Recurrent testing in a clinical or biomedical engineering setting has a different purpose again: identifying deterioration, damage, or repair-related faults without necessarily repeating every type-test condition.
A complete protocol identifies the unit under test, software and hardware revision, test equipment, calibration status, environmental conditions, test configuration, applicable standard edition, acceptance limits, and operator safety controls. Without that context, a measured leakage current or delivered-energy value is difficult to interpret and even harder to defend during an audit or failure investigation.
Separate Electrical Safety From Defibrillation Performance
Electrical safety testing and defibrillator output testing are related, but they are not interchangeable. An electrical safety analyzer evaluates conditions such as protective-earth continuity, insulation integrity, dielectric withstand capability, and leakage current. A defibrillator analyzer or appropriately rated energy measurement system evaluates delivered energy, charge time, waveform characteristics, synchronization behavior, and related functional performance.
Using one instrument in place of the other creates blind spots. A hipot result does not confirm that the selected energy setting is delivered within specification. Likewise, a successful discharge into an energy analyzer does not demonstrate that enclosure leakage, patient leakage, or mains isolation meets the required limits.
The test sequence should also account for device architecture. A battery-powered AED with an external charger may require separate assessment of the charger, charging contacts, mains-connected circuits, and battery-operated modes. A hospital defibrillator with monitoring and pacing functions may include additional patient leads and applied-part paths that affect the electrical safety setup.
Verify the High-Voltage Output Path
Defibrillator output verification requires equipment designed to absorb and measure high-energy pulses safely. The load, input rating, connectors, and cabling must be rated for the maximum energy and voltage the device can deliver. Operators should never improvise a load, substitute general-purpose measurement inputs, or handle paddles or electrode connectors during a charged or discharge-capable state.
For each prescribed energy setting and applicable operating mode, verify delivered energy into the specified load. Depending on the device design and standard requirements, the protocol may also evaluate charge time, maximum available energy, charge indication, disarm behavior, automatic discharge, and synchronized cardioversion timing. Waveform capture can identify faults that a single energy number may miss, including abnormal pulse duration, polarity behavior, or decay characteristics.
A high-voltage test system with adequate bandwidth, input range, and sampling capability provides more useful evidence than a pass/fail indication alone. Captured waveforms allow engineering teams to compare pulse shape across production lots, investigate intermittent switching faults, and establish trends before a unit fails a final limit.
Test Leakage and Isolation in Representative States
Leakage current results depend on the selected measurement network, supply configuration, applied-part configuration, polarity, and normal or single-fault condition. The protocol must define these conditions rather than treating leakage as one universal measurement. Protective-earth continuity should likewise be evaluated using the prescribed test current, test points, and acceptance criteria for the applicable standard.
Patient-connected circuits deserve particular attention. Defibrillators may use ECG electrodes, therapy pads, paddles, monitoring accessories, or interfaces connected to other equipment. The test configuration should represent the combinations that create credible exposure paths, including accessories and ports that may be present during therapy or monitoring.
Dielectric withstand testing can reveal inadequate clearance, contamination, insulation damage, or assembly defects, but test voltage and duration must be selected carefully. Applying an arbitrary high voltage can damage sensitive circuits or create an invalid result. Follow the product specification and governing standard, and use a controlled instrument with current limits, ramping capability, clear failure indication, and repeatable settings.
Control the Test Environment and Operator Risk
A defibrillator safety station should be engineered as a controlled high-voltage work area, not assembled temporarily at a bench. Clearly marked connections, guarded discharge interfaces, emergency-stop provisions where appropriate, and defined access boundaries reduce the opportunity for operator error.
Before testing, confirm that the energy analyzer or load is connected, that the device is in the intended mode, and that all required patient connections are routed to their specified fixtures. After a failed or interrupted charge cycle, follow the device procedure for disarming and verifying stored-energy removal. A device may retain hazardous energy after a test sequence appears complete.
Test automation can improve repeatability, particularly in production environments, but it does not eliminate the need for interlocks and fail-safe logic. Automated fixtures should prevent an output discharge unless the correct load path is verified. They should also record the selected test recipe, serial number, measured values, operator identity when required, and instrument status.
Use Measurement Systems That Support the Required Uncertainty
The value of a test result depends on confidence in the measurement system. For energy and waveform measurements, consider instrument accuracy, bandwidth, sampling rate, load tolerance, trigger repeatability, and the effect of cabling and fixture parasitics. For electrical safety measurements, consider test-source capability, measurement resolution, settling time, and the instrument’s ability to execute the intended standard-specific sequence.
Calibration traceability is equally practical. If a unit fails near a specification limit, the test team needs to know whether the condition is a product defect, a fixture issue, a changed accessory, or a measurement-system error. Current calibration records, controlled fixtures, and documented verification checks shorten that investigation.
Vitrek high-voltage measurement and electrical safety test solutions can support controlled, repeatable verification where a standard test sequence must be combined with engineering-grade measurement data. The right configuration still depends on the defibrillator’s voltage range, output architecture, production volume, and required level of automation.
Build Records That Make Results Actionable
A pass/fail result alone rarely provides enough value for a safety-critical medical device. Store the measured value, limit, test condition, instrument configuration, firmware revision, serial number, and timestamp. For output tests, retain waveform data or a defined waveform summary when it is relevant to the product requirement.
When a failure occurs, isolate the result before retesting. Repeated testing without a documented disposition can conceal intermittent faults or expose a compromised unit to further stress. A disciplined process distinguishes a test-system anomaly from a product nonconformance and preserves the evidence needed for corrective action.
The most effective medical defibrillator safety test is not simply the fastest sequence that produces a green indicator. It is the controlled process that shows, with defensible measurements, that the unit can deliver therapy as intended while protecting the patient, operator, and service team.
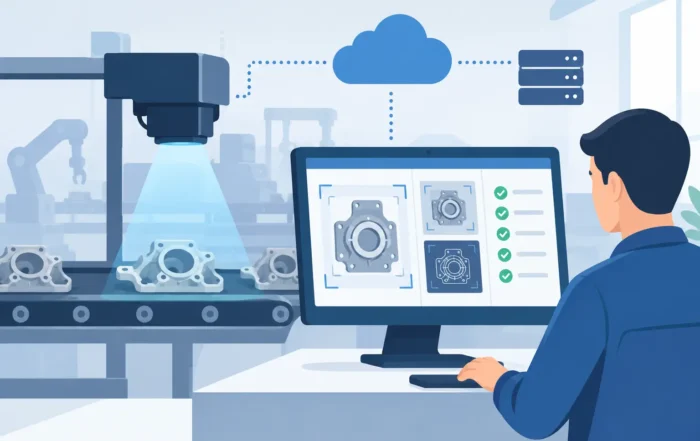
Industrial Digitizer Software for Reliable Capture
A high-speed digitizer is only as useful as the data an engineer can acquire, interpret, and defend. Industrial digitizer software provides the operating layer between the instrument and the test decision, converting sampled waveforms into time-correlated, reviewable evidence. In aerospace qualification, power electronics development, defense diagnostics, and production test, that distinction matters: an impressive sample rate does not compensate for incomplete records, poorly defined triggers, or analysis settings that cannot be reproduced.
The right software shortens setup time without hiding measurement choices. It must give engineers direct control over acquisition parameters, preserve raw data when needed, support repeatable analysis, and fit into the wider test environment. That combination is what turns a digitizer from a data source into a dependable measurement system.
What Industrial Digitizer Software Must Control
At a minimum, digitizer software should configure the acquisition path with the same discipline applied to the hardware itself. Engineers need clear access to sample rate, input range, channel selection, coupling, impedance, clock source, trigger mode, trigger level, pretrigger memory, record length, and acquisition count. These are not administrative settings. Each one can affect whether a transient is captured accurately or missed entirely.
Trigger configuration deserves particular attention. A switching event, fault condition, burst transmission, or intermittent vibration signature may occur only briefly and under specific operating conditions. Software should support practical trigger strategies, including edge, level, external, and software-controlled triggers where the hardware supports them. It should also make trigger position and pretrigger capture visible, so a user can verify that the waveform includes the conditions leading into the event rather than only its aftermath.
Memory management is equally important. A long capture at a high sample rate can consume substantial onboard and host memory. The software must help users balance record duration, resolution, channel count, and transfer time. There is no single best setting. A power-conversion fault investigation may demand long records and deep memory, while a repetitive RF or IF event may benefit more from segmented acquisition and rapid re-arming.
Acquisition settings should remain visible
A useful interface does not bury consequential settings behind automated defaults. Automation can accelerate routine work, but an engineer should be able to inspect the active configuration before a run and associate it with the saved result. This is especially relevant when multiple teams use the same test station, when a program transitions from R&D to production, or when results may be reviewed months later during a corrective-action investigation.
The Difference Between Viewing Data and Analyzing It
Plotting a waveform is necessary, but it is not analysis. Industrial applications often require measurements that can be repeated across thousands of records, compared against limits, or correlated with another instrument and a unit under test.
Effective digitizer software supports standard time-domain measurements such as peak amplitude, RMS, rise time, pulse width, overshoot, period, and frequency. It should also support cursors, zoom, annotations, mathematical functions, and FFT analysis where frequency-domain behavior is relevant. For a switching power supply, engineers may need to measure ringing frequency and overshoot following a switching edge. For a vibration or machinery diagnostic application, they may need to identify periodic components, impulsive events, or changes in spectral content.
The key requirement is not the length of the measurement menu. It is confidence that measurements use defined algorithms, appropriate units, and clearly stated reference points. Rise-time results, for example, can differ based on the percentage thresholds selected. FFT displays depend on sample length, window function, averaging, and scaling. Software should expose these conditions rather than present a single number without context.
For compliance-oriented workflows, limit testing can be equally valuable. Applying upper and lower bounds, pass/fail masks, or user-defined criteria enables faster review of repetitive test data. That said, limits should be treated as controlled test parameters. A mask that is appropriate for screening production assemblies may be too broad for root-cause analysis, where the full waveform and its variation over time are more informative.
Data Integrity Is a System Requirement
In regulated and mission-critical environments, a waveform file is not merely a screenshot. It may support design verification, failure analysis, calibration records, or a customer quality report. Industrial digitizer software should preserve the information required to understand where the data came from and how it was acquired.
That begins with file formats and metadata. Saved records should retain acquisition settings, channel scaling, timebase information, trigger conditions, timestamps, and instrument identification. If analysis results are exported, the source record and calculation parameters should remain traceable. Images are useful for communication, but they should not be the only retained artifact when engineering decisions depend on the underlying data.
Data export also needs practical consideration. Engineers may need waveform samples in a standard format for MATLAB, Python, LabVIEW, custom databases, or quality systems. CSV can be convenient for simple exchange, but it can become inefficient for long, high-resolution records and may not retain all acquisition metadata. Binary or structured formats can offer better performance and fidelity. The appropriate choice depends on record size, downstream tools, and traceability requirements.
Version control applies to test software as well as product firmware. A change in analysis code, device driver, digitizer firmware, or operating system can alter behavior. Teams should record software versions for formal test campaigns and validate changes before deploying them to production or qualification stations.
Choosing Industrial Digitizer Software for the Workflow
Selection should start with the measurement problem, not with a feature checklist. The following questions help define the software requirement:
- Is the primary task interactive troubleshooting, automated test, continuous recording, or post-process analysis?
- What event must trigger capture, and how much pre-event data is needed?
- How many channels must be synchronized, and is an external clock or trigger required?
- What data must be retained for quality, compliance, or design-review purposes?
- Which engineering environments must receive the data or control the instrument?
An application used occasionally at an engineering bench benefits from an intuitive graphical interface, rapid display updates, and simple export. A production test cell has different priorities: deterministic control, error handling, remote operation, result logging, and easy integration with test executive software. A long-duration field recording system may place greater weight on streaming performance, storage management, and unattended recovery after a communication interruption.
These requirements can overlap, but they should not be assumed to be identical. A graphical application may be ideal for developing a test method, while an SDK provides the control and repeatability needed to deploy that method at scale.
SDK access matters in automated systems
For automated test environments, an SDK is often a core requirement rather than an optional accessory. It enables software teams to configure the digitizer, arm acquisitions, retrieve records, apply analysis, and log results through controlled program logic. Support for common development environments can reduce integration effort, but driver quality, documentation, example code, and technical support are just as significant.
The best SDK does not simply expose every hardware register. It provides a stable path to the functions engineers need while maintaining access to advanced capabilities. It should also report meaningful errors. A generic communication failure is far less useful than an indication that the requested sample rate, channel configuration, or memory allocation cannot be supported.
Performance Limits Software Cannot Fix
Software is essential, but it cannot correct a mismatch between the digitizer and the signal. Bandwidth, sample rate, vertical resolution, effective number of bits, input range, front-end noise, timing accuracy, and onboard memory remain hardware considerations. Poor probing, inadequate shielding, improper grounding, and overloaded inputs can also compromise a result before the software sees a sample.
This is why software should help engineers identify acquisition quality rather than conceal it. Status indicators for clipping, trigger state, sample rate, clock source, and acquisition completion can prevent avoidable errors. Visual scaling and history views can reveal drift or intermittent behavior. For multi-instrument tests, explicit synchronization status is more credible than assuming a shared trigger guarantees timing alignment.
High-performance digitizers from providers such as GaGe are typically selected for demanding capture requirements, but the software environment determines how effectively that hardware is used in daily test work. Instrument capability and workflow capability must be evaluated together.
A Practical Validation Process
Before releasing a digitizer-based procedure for production or formal verification, validate the complete measurement chain. Use known signals or calibrated references to confirm amplitude accuracy, timing, trigger behavior, scaling, and analysis calculations. Test expected operating conditions as well as boundary cases: minimum and maximum input levels, noisy triggers, long records, multiple active channels, and extended acquisition runs.
Review what happens when the system encounters an abnormal condition. Does the application identify a timeout? Does it distinguish a failed limit from a failed acquisition? Does it save partial or invalid data without marking it as a valid result? These behaviors affect test integrity as much as nominal waveform display performance.
Document the approved configuration, including digitizer settings, software version, analysis parameters, file naming conventions, and acceptance criteria. This creates a usable baseline for technicians and a defensible record for engineering and quality teams.
A well-chosen digitizer application should make the next measurement easier to trust than the last. When settings, waveforms, analysis, and records remain connected, engineers can spend less time reconstructing what happened and more time resolving the behavior the data reveals.
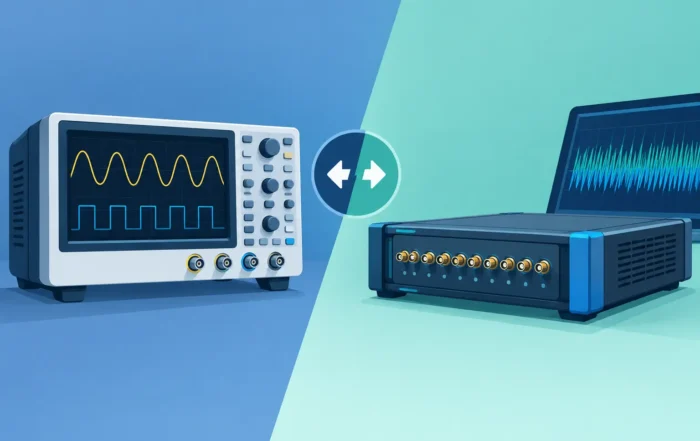
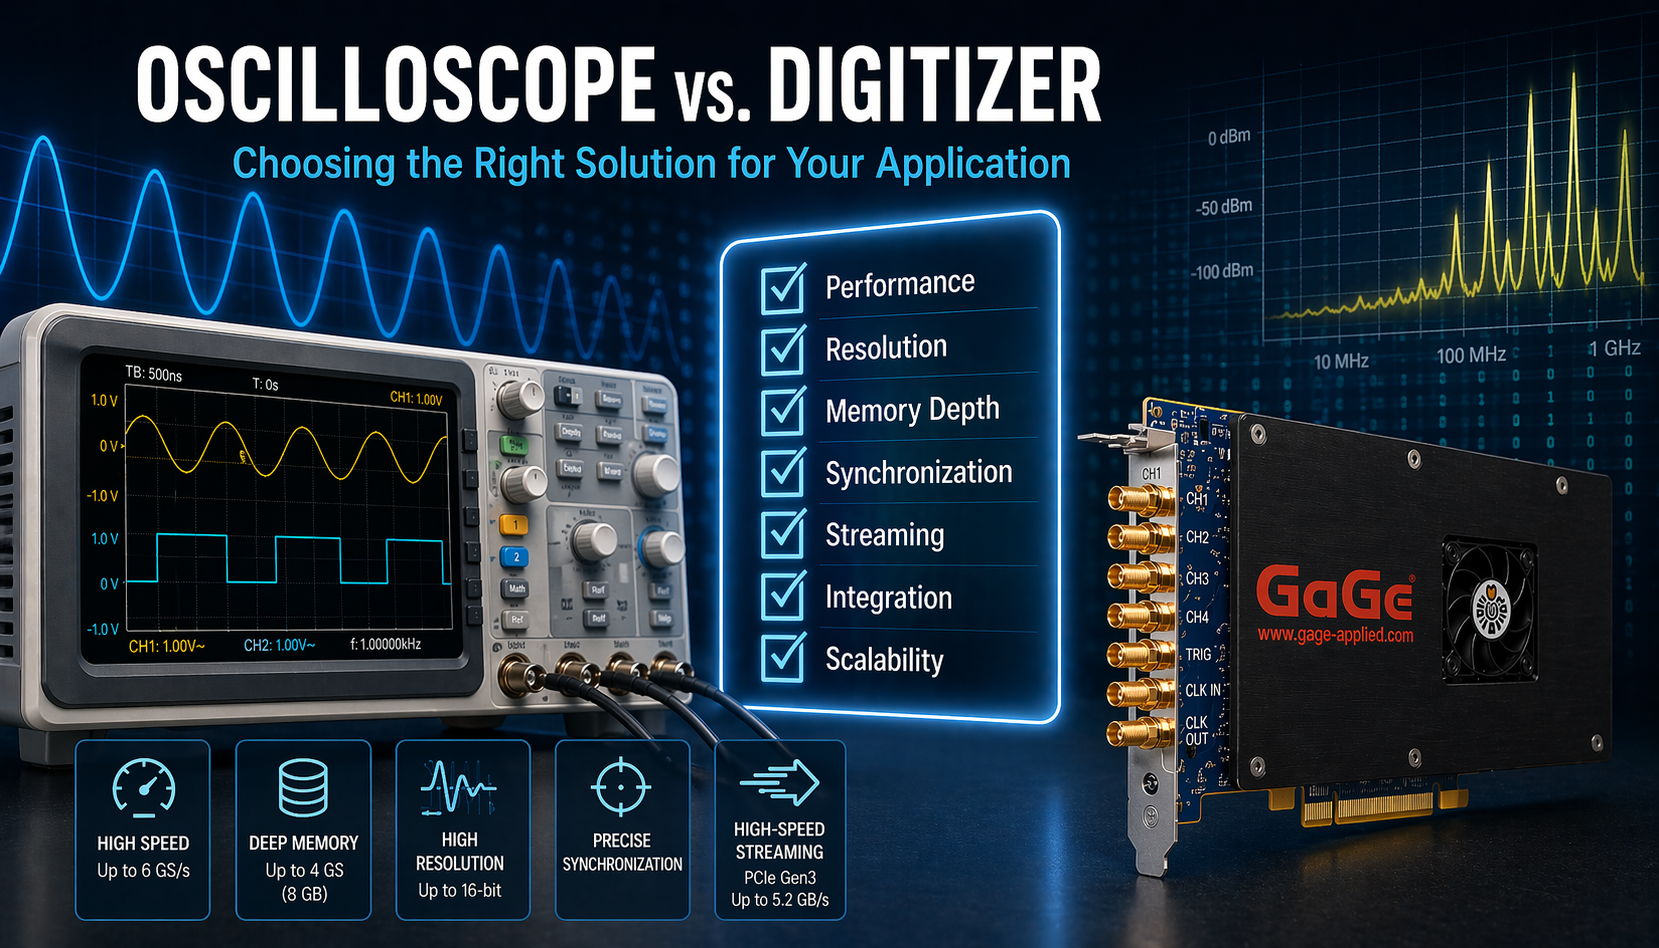
Oscilloscope Versus High Speed Digitizer Choices
A transient appears once during a high-voltage switching test. A radar IF event must be recorded for later analysis. A multi-channel vibration test needs every sample aligned across a long acquisition window. In each case, the question of an oscilloscope versus high speed digitizer is not about which instrument is more capable in general. It is about whether the test requires immediate waveform visibility, sustained acquisition, deterministic integration, or data capture that can be analyzed long after the event has passed.
An oscilloscope and a high-speed digitizer can share fundamental building blocks: analog front ends, analog-to-digital converters, sample clocks, trigger circuits, and acquisition memory. Their practical roles, however, are different. Selecting the right platform affects test coverage, measurement confidence, automation effort, data-management requirements, and the ability to reproduce a result during engineering review or compliance investigation.
Oscilloscope Versus High Speed Digitizer: The Core Difference
An oscilloscope is primarily a self-contained measurement instrument. It combines acquisition hardware with an integrated display, front-panel controls, trigger setup, waveform processing, and measurement functions. An engineer can connect a probe, set vertical scale and time base, establish a trigger condition, and assess a signal within minutes. This direct interaction makes an oscilloscope highly effective for bench troubleshooting, circuit bring-up, design validation, and signal-integrity investigation.
A high-speed digitizer is designed first as a data-acquisition engine. It converts analog signals into digital samples and transfers or stores those samples for processing in a host computer or embedded test system. Rather than relying on a front panel and integrated display, digitizers use software, drivers, and software development kits to support custom workflows. Their value becomes especially clear when acquisition must be tightly synchronized, sustained over long records, automated across many test sequences, or incorporated into a rack-mounted system.
Neither approach is inherently superior. A scope reduces the time from signal connection to visual insight. A digitizer provides greater architectural control when waveform data is one component of a larger measurement system.
Start With the Measurement Objective
The instrument choice should follow the required measurement outcome, not simply sample-rate specifications. For a technician isolating ringing on a gate-drive signal or checking the rise time of a control pulse, an oscilloscope is usually the efficient choice. Its display, automated measurements, cursors, and triggering controls allow rapid iteration at the bench.
For an aerospace environmental test, a defense RF recording application, or a manufacturing diagnostic station, the requirement may be different. The team may need to acquire a defined record on several channels, associate it with serial numbers and operating conditions, store it automatically, and execute the same sequence hundreds of times. In that situation, a digitizer can be the more appropriate foundation because it is built to operate under software control within a repeatable system architecture.
The key question is simple: does the user need to observe a waveform now, or capture trustworthy data for processing, storage, correlation, and repeatable decisions? Many laboratories require both. The scope supports development and debug, while the digitizer supports deployed test and long-term data collection.
Compare the Specifications That Actually Matter
Sample rate and analog bandwidth are necessary starting points, but they do not resolve the decision on their own. A high sample rate cannot compensate for inadequate analog bandwidth, poor trigger behavior, insufficient memory depth, or an acquisition architecture that does not fit the test sequence.
Bandwidth, sample rate, and signal fidelity
Bandwidth defines the range of signal frequencies the analog input can pass within its specified response. It is central to preserving fast edges, RF content, and transient behavior. Sample rate determines the spacing of captured samples. For periodic signals, the Nyquist criterion establishes a theoretical lower boundary, but practical engineering work commonly requires oversampling to characterize waveform shape, timing, overshoot, and spectral content with confidence.
Both scopes and digitizers are available at high bandwidths and sample rates. The better choice depends on whether that performance must be accessed through an interactive instrument or integrated into a controlled acquisition platform. Engineers should also review effective number of bits, input noise, full-scale input ranges, impedance options, and the behavior of the front end under real signal conditions. A fast measurement that clips, adds excessive noise, or obscures small signal changes is not a useful measurement.
Memory depth and record duration
Record length is often the deciding factor. Acquisition time is determined by memory depth divided by sample rate. At high sample rates, a short memory fills quickly. This can be acceptable when inspecting a brief switching transition, but it can limit analysis when the event of interest is separated from its trigger by milliseconds, seconds, or longer.
High-speed digitizers are frequently selected for applications that require long, contiguous records or controlled multi-record acquisition. Examples include capturing startup behavior in power systems, recording IF signals, monitoring intermittent faults, and collecting vibration data through a complete test cycle. The required record should include pre-trigger context, the event itself, and sufficient post-trigger time to identify the system response.
Engineers should verify whether the published memory specification applies per channel, is shared between enabled channels, or changes with acquisition mode. They should also determine whether data can be streamed continuously at the needed rate and for the required duration. Sustained streaming is a system-level requirement involving the digitizer, interface, host computer, storage subsystem, and software architecture.
Triggering and event capture
A scope typically provides an accessible set of trigger modes for everyday debugging: edge, pulse width, runt, logic, serial pattern, and protocol-aware triggers in applicable models. This makes it exceptionally useful when an engineer is still learning what causes an intermittent event.
Digitizer triggering can be equally important, particularly when the acquisition must be initiated by an external system, synchronized with other instruments, or aligned with a physical test event. External triggers, clock references, pre-trigger capture, timestamping, and deterministic trigger latency may matter more than an extensive front-panel trigger menu. In automated systems, trigger reliability is part of measurement integrity. A missed event can invalidate an entire test run.
Channel count and synchronization
Multi-channel work deserves careful review. Comparing channel count alone is not enough. The relevant questions are whether channels sample simultaneously, share a coherent clock, maintain phase alignment, and can be synchronized with additional instruments.
A multi-channel oscilloscope can be very effective for observing related signals during development. A digitizer architecture may be preferred when a test system requires synchronized modules, external clock distribution, or coherent capture across a larger channel count. These requirements are common in phased measurement, vibration and modal analysis, power-conversion diagnostics, RF/IF recording, and hardware-in-the-loop test environments.
Integration Changes the Economics
The purchase price of an instrument is only one component of the cost of measurement. For a one-time investigation or a lab bench shared by many engineers, the integrated interface of an oscilloscope can save meaningful time. The user can obtain results without writing acquisition code, creating a data schema, or designing a custom display.
For repetitive production, qualification, or research acquisition, manual interaction can become the expensive path. A digitizer supports automated configuration, programmed triggering, pass/fail analysis, metadata capture, and file handling. It can also operate as part of a test executive that coordinates power sources, electronic loads, safety testers, environmental chambers, motion systems, and other instruments.
This advantage comes with responsibility. A digitizer-based system requires engineering effort for software validation, driver management, error handling, data storage, calibration planning, and cybersecurity controls where applicable. The most effective deployments define these requirements early rather than treating the digitizer as a plug-in replacement for a scope.
A Practical Selection Framework
Choose an oscilloscope when the primary need is interactive visibility and rapid troubleshooting. It is especially well suited to circuit debug, prototype evaluation, timing verification, and applications where engineers benefit from changing settings while watching the waveform response.
Choose a high-speed digitizer when acquisition must be automated, synchronized, sustained, or deeply integrated with a host application. It is often the right choice for long-record transients, multi-channel recording, custom analysis, remote operation, and test systems that must execute the same procedure with traceable consistency.
Before specifying either instrument, document the highest frequency of interest, minimum feature rise time, required sample rate, voltage range, input coupling, resolution, channel count, trigger source, pre- and post-trigger time, record length, repetition rate, and data-retention requirements. Add the environmental and operational constraints: rack space, calibration interval, support for required standards, software environment, and expected service life. These details identify limitations that a headline specification can hide.
Measurement Confidence Depends on the Complete Chain
The acquisition instrument is only one part of the measurement chain. Probes, cables, attenuators, current sensors, isolation methods, grounding practices, clock sources, and calibration status can influence results as much as the converter itself. This is particularly true in high-voltage, high-energy, and fast-switching environments, where poor interconnection practices can introduce noise, ground loops, distorted edges, or unsafe test conditions.
For regulated and mission-critical programs, establish documented settings and verification procedures for the complete setup. Calibration traceability, repeatable connection methods, controlled software versions, and retained raw data all help turn a waveform into defensible engineering evidence. Suppliers such as Vitrek support this system-level view by combining specialized acquisition hardware with the application expertise needed for demanding test environments.
The best choice is the instrument that preserves the event you need, at the fidelity you can defend, within a workflow your team can repeat. When the requirement is clear, the oscilloscope and the high-speed digitizer stop competing for the same job and become complementary tools in a disciplined measurement strategy.
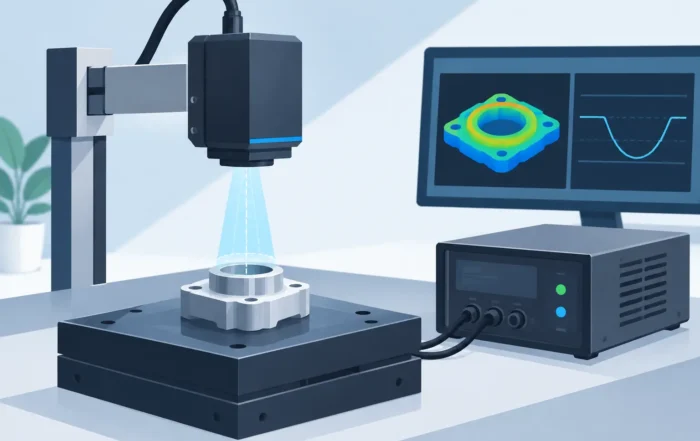
Choosing Noncontact Sensor Controllers for Metrology
A noncontact displacement sensor can be specified correctly and still produce unreliable results if its controller is treated as an accessory. In precision measurement, noncontact sensor controllers establish the excitation, signal conditioning, digitization, filtering, scaling, and communications path that turns a changing gap into usable engineering data. Their performance directly affects whether a system can distinguish actual part movement from electrical noise, thermal drift, fixture instability, or process variation.
For engineers measuring runout, shaft position, wafer geometry, surface motion, or critical assembly gaps, controller selection should begin with the measurement objective rather than a channel-count requirement. The right controller is the one that preserves the needed measurement uncertainty under real operating conditions, including changes in temperature, target material, cable routing, machine vibration, and acquisition timing.
What Noncontact Sensor Controllers Do
A controller supplies and interprets the operating signal for a noncontact probe. In capacitive measurement systems, for example, the controller drives the sensor and converts the resulting change in capacitance into a calibrated displacement output. The controller then provides that value through analog outputs, digital interfaces, or both.
That function sounds straightforward, but several performance characteristics are determined at the controller level. These include measurement range, bandwidth, output noise, linearity, sampling behavior, synchronization capability, and the available filtering options. A probe and controller should therefore be evaluated as a matched measurement system, not as independent components selected by lowest cost or nominal compatibility.
Controller choices also shape integration effort. A laboratory setup may only need a stable analog voltage output and a local display. An automated production cell may require synchronized multi-axis acquisition, deterministic data transfer, software control, alarm thresholds, and traceable storage of measurement records. These are materially different applications, even when both use the same sensor technology.
Start With the Measurement Requirement
The most productive specification process begins by defining what must be measured, where it occurs, and what decision will be made from the result. A controller intended to monitor bearing motion at high speed is not necessarily appropriate for submicron flatness characterization, where lower bandwidth but exceptional noise performance and long-term stability may matter more.
Establish the required measurement range first. The operating range must cover expected movement, alignment tolerance, and transient excursions without placing normal operation near the limits of the calibrated range. At the same time, excessive range can reduce sensitivity. If an application requires nanometer- or micrometer-scale discrimination, specifying more range than necessary may impose an avoidable resolution penalty.
Next, define the smallest meaningful change. This is not always the same as the controller’s published resolution. The relevant question is whether system noise, including the sensor, controller, cabling, target, fixture, and environment, remains low enough to reliably detect the change that matters. A specification measured under controlled laboratory conditions is useful, but it should be compared with expected field conditions.
Bandwidth requires similar discipline. Higher bandwidth allows the system to follow faster events, but it also admits more noise. A high-speed spindle, vibration test fixture, or transient mechanical process may need wide bandwidth and a sampling system capable of capturing it without aliasing. For a slowly changing dimensional measurement, limiting bandwidth can improve repeatability by reducing noise. The best setting depends on signal dynamics, not simply on the highest available performance number.
Match the Controller to the Sensor and Target
Sensor-controller compatibility extends beyond connector fit. The controller must support the probe’s operating principle, range, sensitivity, cable length, and calibration method. Substituting a cable or sensor without confirming the approved configuration can change sensitivity, increase noise, or invalidate calibration data.
Target characteristics also matter. Capacitive sensors are highly sensitive to the electrical properties and geometry of the target. Conductive target material, effective target area, curvature, surface condition, and grounding arrangement can all affect the measurement. A controller calibrated against a flat, grounded metallic target may require a different calibration approach when measuring a small curved component or an application-specific fixture.
For applications involving conductive and nonconductive materials, changing surfaces, or larger stand-off distances, a different sensing technology may be more suitable. The controller decision should follow the sensor technology decision, but the two should be made together. A technically capable controller cannot compensate for a sensing method that is poorly matched to the target.
Consider cabling and grounding early
Many apparent controller problems originate in the installation. Sensor cables should be routed away from motor leads, switching power supplies, RF sources, and high-current conductors where practical. Cable length and type should remain within the system manufacturer’s approved limits. Ground loops, poor shielding termination, and an unstable target reference can introduce low-frequency drift or periodic interference that resembles actual displacement.
A pre-installation review should document sensor mounting, target grounding, cable routing, controller location, and the interface to the data acquisition or control system. This is particularly valuable in production environments, where a measurement system may be installed long after the original design team has moved on.
Evaluate Noise, Stability, and Repeatability Together
Resolution alone is not a complete indicator of measurement quality. A controller may display very fine digital increments while the actual signal fluctuates by several times that amount. Engineers should review RMS noise, peak-to-peak noise, linearity, thermal behavior, and repeatability over the relevant time period.
Short-term repeatability supports immediate process decisions. Long-term stability matters when measurements are compared across shifts, batches, maintenance intervals, or test locations. Temperature changes can affect electronics, cabling, fixtures, and the measured part itself. If the process involves a thermal chamber, a warm production line, or cycling equipment, characterize the entire setup over the expected temperature range.
Filtering can improve displayed stability, but it should not conceal meaningful motion. A low-pass filter may be appropriate for a static gap measurement, yet it can distort a rapid mechanical event or delay a control response. Document filter settings as part of the measurement method, especially where results support quality acceptance, compliance records, or product validation.
Plan the Data Interface Around the Test Workflow
The output format should serve the system that uses the data. Analog outputs remain effective for legacy data acquisition hardware, machine control, and simple monitoring. Their limitations include susceptibility to external noise, scaling errors, and the need to confirm input range and grounding compatibility at the receiving device.
Digital interfaces can simplify configuration, provide higher-level status information, and support automated data collection. They are especially useful when a test sequence needs to record controller settings, sensor identification, alarms, and measurement values alongside other test data. Interface selection should account for update rate, latency, software support, protocol compatibility, and whether the host system must synchronize multiple channels.
Multi-channel applications introduce another requirement: channel-to-channel timing. Measuring relative motion between two points, calculating runout, or assessing parallelism can require simultaneous or tightly synchronized sampling. Sequential data from independent channels may be acceptable for slow processes but misleading for dynamic ones. Confirm timing architecture before assuming that two channels can support differential or phase-sensitive measurements.
Calibration and Verification Should Be Built Into the Plan
A calibration certificate establishes traceability for a defined configuration at a point in time. It does not eliminate the need for application-level verification. Before releasing a system for production or formal test use, verify performance using an appropriate reference, such as a controlled displacement standard, qualified artifact, or known-good mechanical condition.
Verification intervals depend on risk, usage, environmental exposure, and required uncertainty. A research setup that is reconfigured frequently may need verification after every significant change. A fixed production station may benefit from a scheduled check using a stable artifact and documented acceptance limits. Any replacement of a sensor, cable, controller, mounting fixture, or target configuration should trigger a review of calibration validity.
For regulated or mission-critical work, retain the controller configuration with the measurement record. Range, bandwidth, filter selection, scaling, firmware revision, sensor serial number, and verification status can be as important as the final measured value when investigating an out-of-tolerance result.
A Practical Selection Path
When comparing noncontact sensor controllers, reduce the choice to evidence from the application. Confirm that the controller supports the required sensor and calibrated range. Then validate noise and stability against the smallest meaningful measurement, not only the catalog resolution. Confirm that bandwidth and filtering capture the relevant mechanical behavior, and verify that the interface and timing architecture fit the acquisition workflow.
Finally, assess supportability. In high-consequence environments, engineering assistance, calibration capability, configuration documentation, and availability of replacement components affect total measurement risk. Suppliers with application experience can help identify target-related effects and installation details before they become expensive troubleshooting work.
Vitrek and MTI Instruments systems are designed for applications where displacement data must remain credible from setup through final review. The most useful controller is not necessarily the one with the longest specification table. It is the one that produces repeatable, traceable results in the actual machine, fixture, and operating environment where engineering decisions are made.
Education & Training
Check out our recent presentation of Understanding Electrical Safety Testers at the 2018 San Diego Test Equipment Symposium!