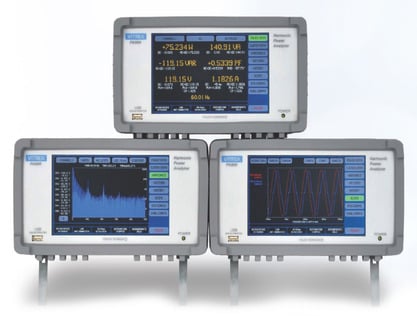
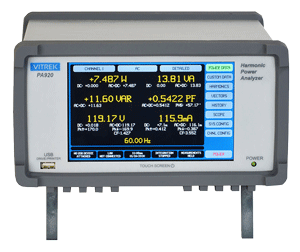
A test result can meet a nominal limit and still be a poor basis for release, compliance, or design decisions. The difference is often hidden in the measurement system rather than the unit under test. Effective test uncertainty budgeting methods make that difference visible by showing how instruments, fixtures, environment, operators, and analysis choices combine around a reported value.
For engineers working in safety testing, power analysis, high-voltage measurement, semiconductor characterization, or production verification, an uncertainty budget is not a documentation exercise. It is the technical evidence behind a guard band, a test limit, a calibration interval, or a decision to replace an apparently capable instrument. The appropriate method depends on the measurement model, available data, required confidence, and consequences of a false accept or false reject.
What a test uncertainty budget must answer
A useful budget starts with a defined measurand: the specific quantity being reported under stated conditions. That may be leakage current during a hipot test, real power at a particular voltage and frequency, a resistance value after a specified settling time, or displacement at a defined location on a wafer stage. A statement such as measure voltage accurately is not a measurand definition.
The budget should answer four practical questions. What inputs affect the result? How large is each input’s contribution? Which contributors dominate the combined uncertainty? What expanded uncertainty supports the reported result at the selected coverage level?
This requires more than copying instrument accuracy specifications into a spreadsheet. An instrument specification may include a percent-of-reading term, a range term, temperature coefficient, bandwidth condition, warm-up requirement, or annual stability assumption. Those terms must be interpreted at the actual operating point. A 0.02% of reading term and a 0.01% of range term behave very differently near the bottom of a measurement range.
The main test uncertainty budgeting methods
Bottom-up analytical budgeting
The bottom-up method is the conventional measurement-model approach and is often the best choice when traceability and defensible technical detail are required. The engineer expresses the result as a function of input quantities, estimates the standard uncertainty for each input, applies sensitivity coefficients, and combines the terms.
For a simple direct voltage measurement, a conceptual model might be:
`Vresult = Vindicated + Ccal + Cresolution + Ctemperature + Cloading`
Each correction or influence is assigned a value, distribution, standard uncertainty, and, where needed, a sensitivity coefficient. Independent standard uncertainties are commonly combined by root-sum-square:
`uc = sqrt(u1² + u2² + … + un²)`
Expanded uncertainty is then typically stated as `U = k × uc`, where the coverage factor k is selected to support the intended confidence level. A value of k = 2 is common for approximately 95% coverage under suitable assumptions, but it should not be applied automatically when the distribution, effective degrees of freedom, or decision rule calls for a different treatment.
Bottom-up budgeting exposes the actual physics and behavior of the test system. It works well for new test methods, high-accuracy calibration work, and measurements with multiple known contributors. Its trade-off is effort. The method can become unwieldy if every minor influence is included without a screening process, or misleading if significant correlations are treated as independent.
Top-down statistical budgeting
A top-down approach estimates uncertainty from observed method performance. The engineer uses repeatability studies, reproducibility studies, historical check-standard data, interlaboratory comparisons, or measurement system analysis to characterize the spread produced by the complete test process.
This method is particularly valuable when the system has complex interactions that are difficult to model individually. Consider an automated end-of-line electrical safety station: fixture contact condition, relay timing, operator loading, dwell time, ambient conditions, and software sequencing may all influence the result. A controlled repeatability and reproducibility study can reveal the aggregate effect more efficiently than attempting to assign a separate analytical term to every interaction.
Top-down evidence has limits. It only represents the conditions sampled by the study. If the test range, product geometry, operator practice, fixture design, or environmental envelope changes, the historical variation may no longer be representative. It can also conceal a bias that is stable but significant. For that reason, top-down analysis should be anchored to traceable references and periodic verification, not used as a substitute for understanding the test method.
Hybrid budgeting
Most industrial programs benefit from a hybrid method. Use analytical components where specifications, calibration data, and physical models are reliable; use empirical data where the process is variable or interactions are difficult to isolate.
For example, a power measurement budget may model analyzer accuracy, voltage and current transducer ratio error, phase error, and reference-source uncertainty from specifications and calibration data. It may then use repeated system-level tests to quantify connector repeatability, thermal stabilization, cable routing effects, and test sequence variation. The hybrid result is usually more realistic than either a pure specification stack-up or a repeatability study alone.
Worst-case stack-up
Worst-case addition treats every contributor as if it reaches its maximum adverse value at the same time. It is simple, conservative, and sometimes appropriate for safety margins, tolerance analysis, or early design decisions where probability distributions are unavailable.
It is not generally a measurement uncertainty estimate. A worst-case value can greatly overstate the likely spread of a result and drive unnecessary equipment cost, excessive guard bands, or rejected product. Use it deliberately when the decision requires a guaranteed bound, and label it clearly as worst-case analysis rather than expanded uncertainty.
Building a budget that survives technical review
Start by mapping the measurement chain from the reference to the recorded result. Include the instrument, sensor or probe, switching path, fixture, cabling, software scaling, algorithm, environmental controls, and operator actions. In high-voltage systems, leakage paths, capacitive loading, settling behavior, and guard connections can be as consequential as meter accuracy. In dynamic acquisition, bandwidth, sampling clock uncertainty, trigger alignment, and signal-processing choices may dominate instead.
Separate Type A and Type B evaluations. Type A uncertainty is evaluated statistically from repeated observations, such as standard deviation from a repeatability run. Type B uncertainty is evaluated from other evidence, including calibration certificates, manufacturer specifications, engineering judgment, environmental limits, or prior data. Both must be converted to standard uncertainty before combination.
Distribution assumptions matter. A calibration certificate may provide expanded uncertainty with a stated coverage factor, while a bounded specification without evidence of probability may be treated as rectangular, yielding a standard uncertainty of half-width divided by the square root of three. A resolution contribution is often rectangular as well. Do not assign distributions by habit; document why the selected distribution represents the available information.
Treat correlation as an engineering issue
The root-sum-square equation assumes inputs are independent. Many real test systems violate that assumption. A common ambient temperature change can shift several channels in the same direction. A shared timebase can couple measurements. Applying the same reference standard to multiple corrections can introduce common uncertainty.
Ignoring positive correlation may understate uncertainty; assuming full correlation where none exists may overstate it. If contributors are correlated, include covariance terms or reformulate the model so the common influence is represented once. This is especially important in ratio, differential, multi-channel, and power measurements, where some common errors cancel while others reinforce.
Use sensitivity coefficients, not assumptions
A contributor does not always affect the result one-for-one. In a calculated power result, voltage, current, and phase inputs have different sensitivities that vary with load conditions. In a resistance measurement, lead resistance may be nearly irrelevant with a proper four-wire method but substantial in a two-wire configuration. Sensitivity coefficients identify where better instrumentation, better fixturing, or improved control will actually reduce the result uncertainty.
Numerical simulation can be preferable when the model is nonlinear, distributions are non-normal, or inputs have limits that make linear propagation questionable. Monte Carlo simulation is not automatically superior, but it is a practical check when a simple linearized model no longer represents the test conditions.
From uncertainty budget to a defensible decision rule
The final budget should support a decision, not merely produce a number. When a measured result is compared with a specification limit, the organization must define how uncertainty is handled. A guard band can reduce the chance of accepting nonconforming product, but it also increases the chance of rejecting conforming product. The appropriate balance depends on product risk, regulatory requirements, contract terms, and the capability of the test process.
For a high-consequence insulation or dielectric withstand requirement, a conservative guard band may be justified. For a tightly controlled manufacturing parameter with costly scrap exposure, improving the measurement system may be more economical than continuously widening the acceptance margin. The budget shows which choice is supported by data.
Maintain the budget as a controlled engineering record. Update it when calibration results shift, an instrument range changes, firmware alters a calculation, a fixture is redesigned, a sensor is replaced, or the environmental operating range expands. Traceable equipment is necessary, but traceability alone does not prove that the complete test system is fit for purpose.
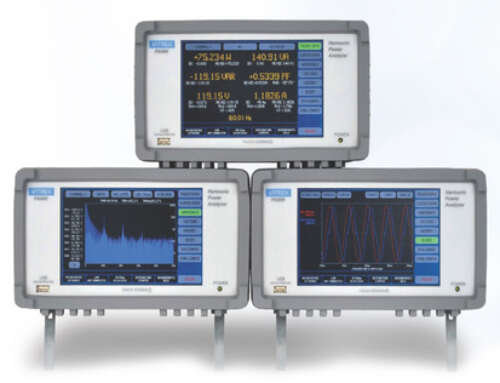
Instruments with well-defined accuracy, stability, and operating conditions reduce uncertainty at the source. Systems such as Vitrek precision measurement and safety test platforms can provide the specified performance needed for demanding applications, but the complete test setup still determines the reported uncertainty. A budget that reflects the actual measurement chain gives engineering teams a clearer path to credible results, appropriate margins, and decisions they can defend when the test data matters most.