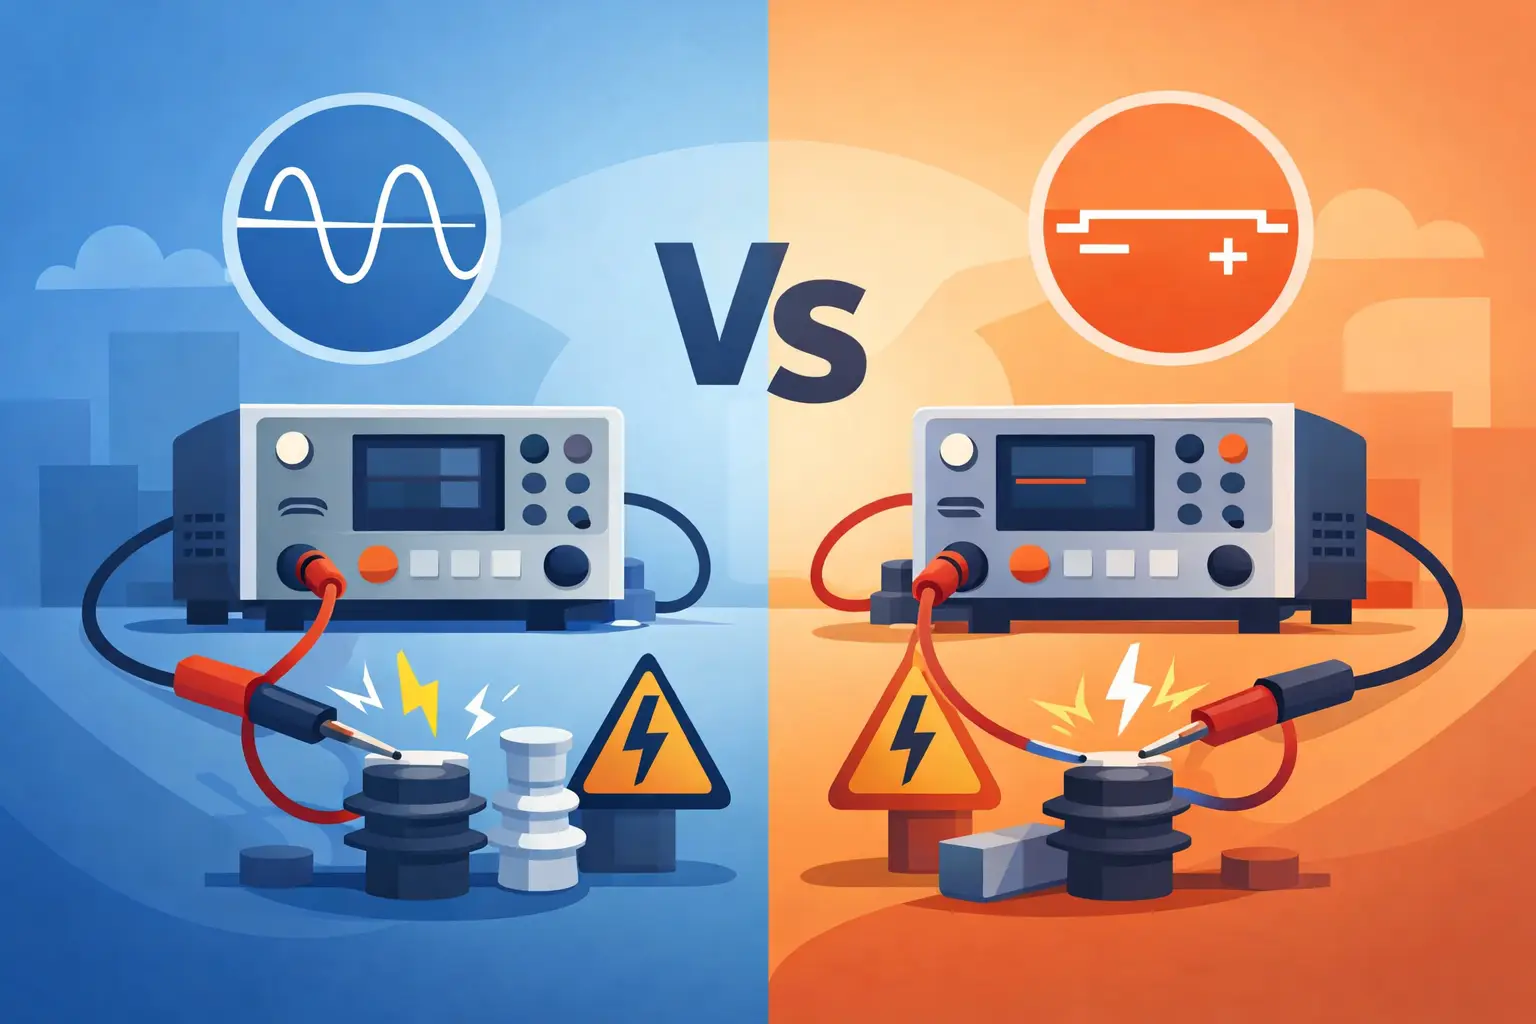
A PWM inverter can appear to operate correctly while producing distortion that changes motor heating, line-current quality, conducted emissions, and calculated power. Inverter harmonic measurement turns that waveform behavior into defensible data. For R&D, validation, and production teams, the objective is not simply to report a total harmonic distortion value. It is to determine which frequency components are present, where they originate, and whether the measurement method is appropriate for the applicable requirement.
That distinction matters because inverter waveforms are not sinusoidal by design. Fast switching edges, modulation sidebands, dead-time effects, DC-bus ripple, control-loop behavior, and connected load characteristics all shape the result. A measurement system must capture the relevant behavior without confusing switching noise, probe limitations, aliasing, or non-coherent sampling with actual inverter performance.
What inverter harmonic measurement must reveal
At the fundamental level, harmonic analysis decomposes a periodic voltage or current waveform into frequency components at integer multiples of its fundamental frequency. A 60 Hz output, for example, may contain components at 120 Hz, 180 Hz, 300 Hz, and higher orders. These components can affect RMS current, copper and core losses, torque ripple, acoustic noise, and the stress placed on downstream equipment.
For a grid-connected inverter, the current waveform at the point of connection is frequently the primary concern. For a motor drive, engineers may need to examine both inverter output voltage and motor current. In either case, the measured result depends on the operating condition. DC bus voltage, output frequency, load torque, modulation index, switching frequency, temperature, and control mode can materially change the spectrum.
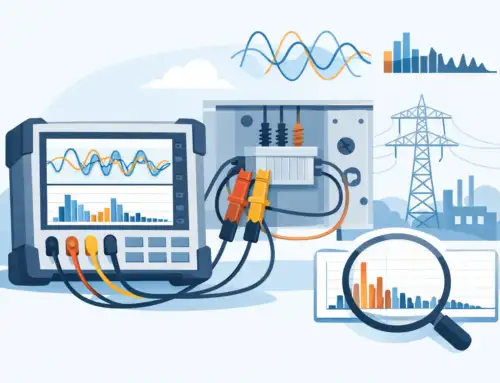
Total harmonic distortion is useful as a compact indicator, but it is not a complete diagnosis. Two inverters can report similar THD values while presenting very different harmonic profiles. One may be dominated by low-order current harmonics that affect power quality requirements. Another may show energy concentrated around switching-frequency sidebands, which can be more relevant to filtering, electromagnetic compatibility, insulation stress, or motor losses. The harmonic table and spectrum should therefore accompany any THD result used for engineering decisions.
Match the measurement bandwidth to the question
The first technical decision is defining what the test must measure. A utility-interconnection assessment, a motor efficiency study, and an inverter switching investigation require different bandwidths, acquisition windows, sensors, and reporting methods.
For line-frequency harmonic compliance work, the relevant analysis range may be limited to a defined harmonic order under a specific standard. IEC 61000-3-2 and IEC 61000-3-12 address harmonic current emissions for different categories of equipment, while IEEE 519 addresses harmonic control at the point of common coupling. These documents are not interchangeable, and their test conditions, averaging rules, source conditions, and limits must be applied as written.
A broader engineering investigation may need to include high-order harmonics, interharmonics, and switching-frequency components. That requires sufficient analog bandwidth and sampling rate, but more bandwidth is not automatically better. A wide measurement bandwidth can include high-frequency noise that is irrelevant to a compliance metric and can obscure comparisons between test runs. Define the required frequency range first, then select instrumentation and filtering that preserve the components of interest.
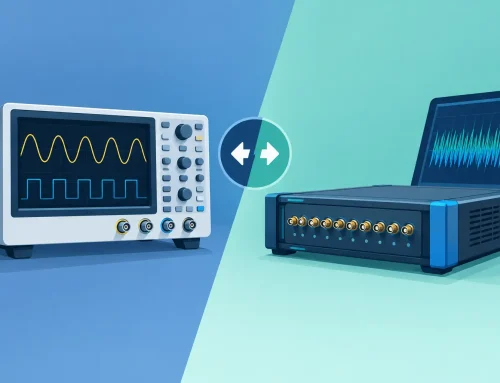
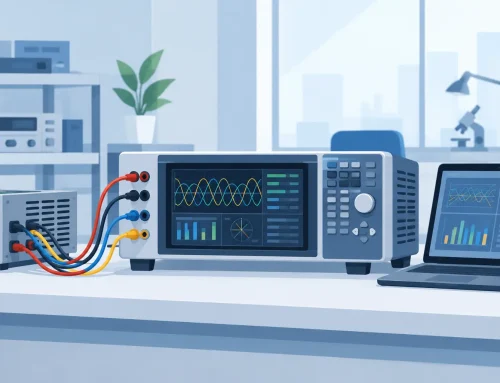
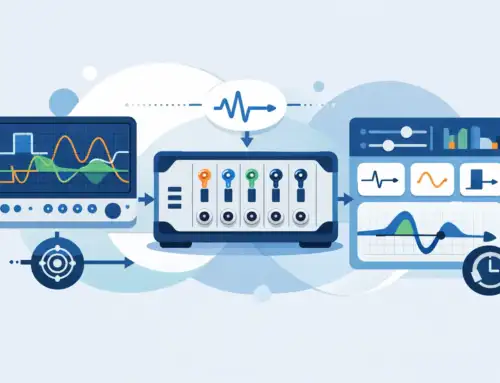
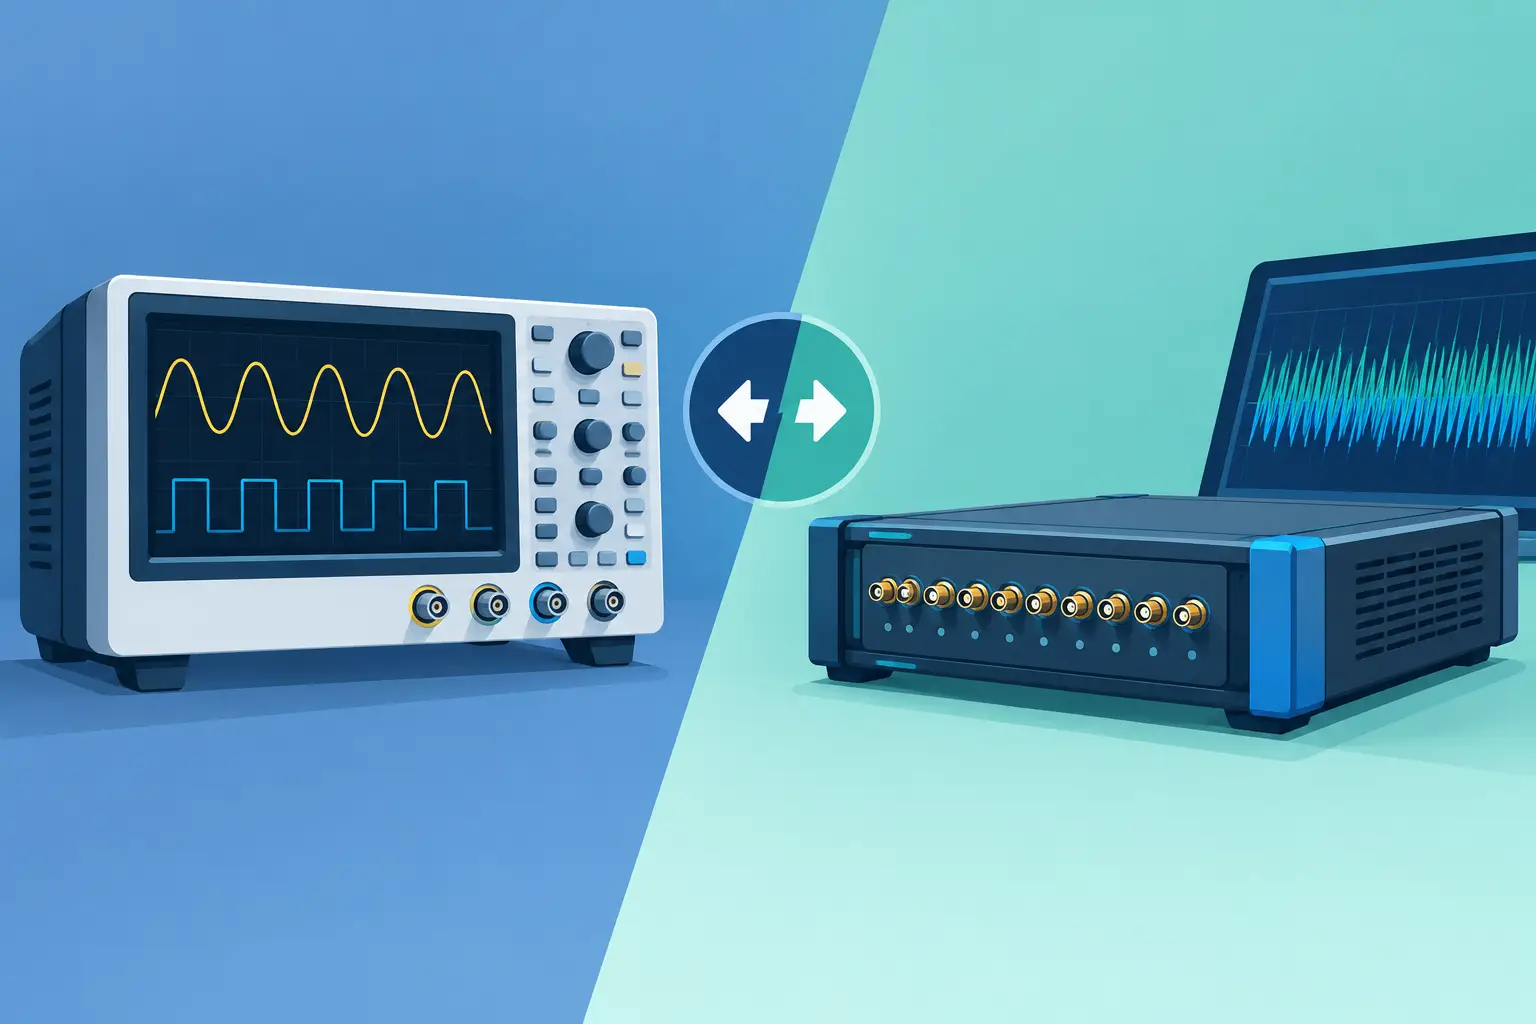
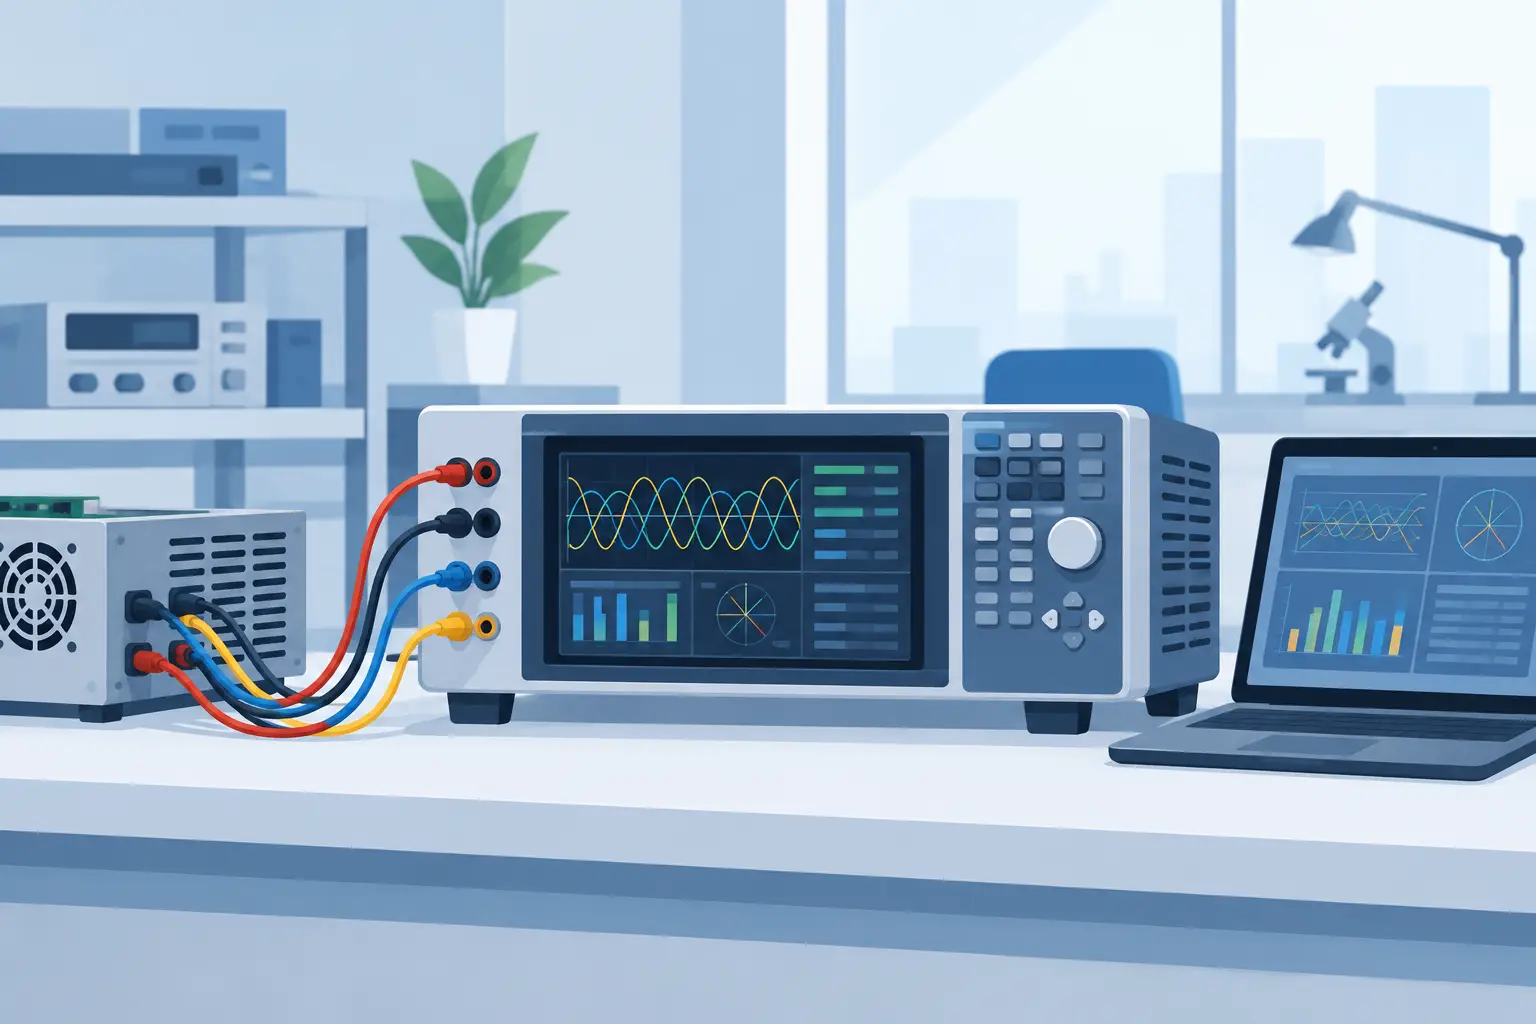
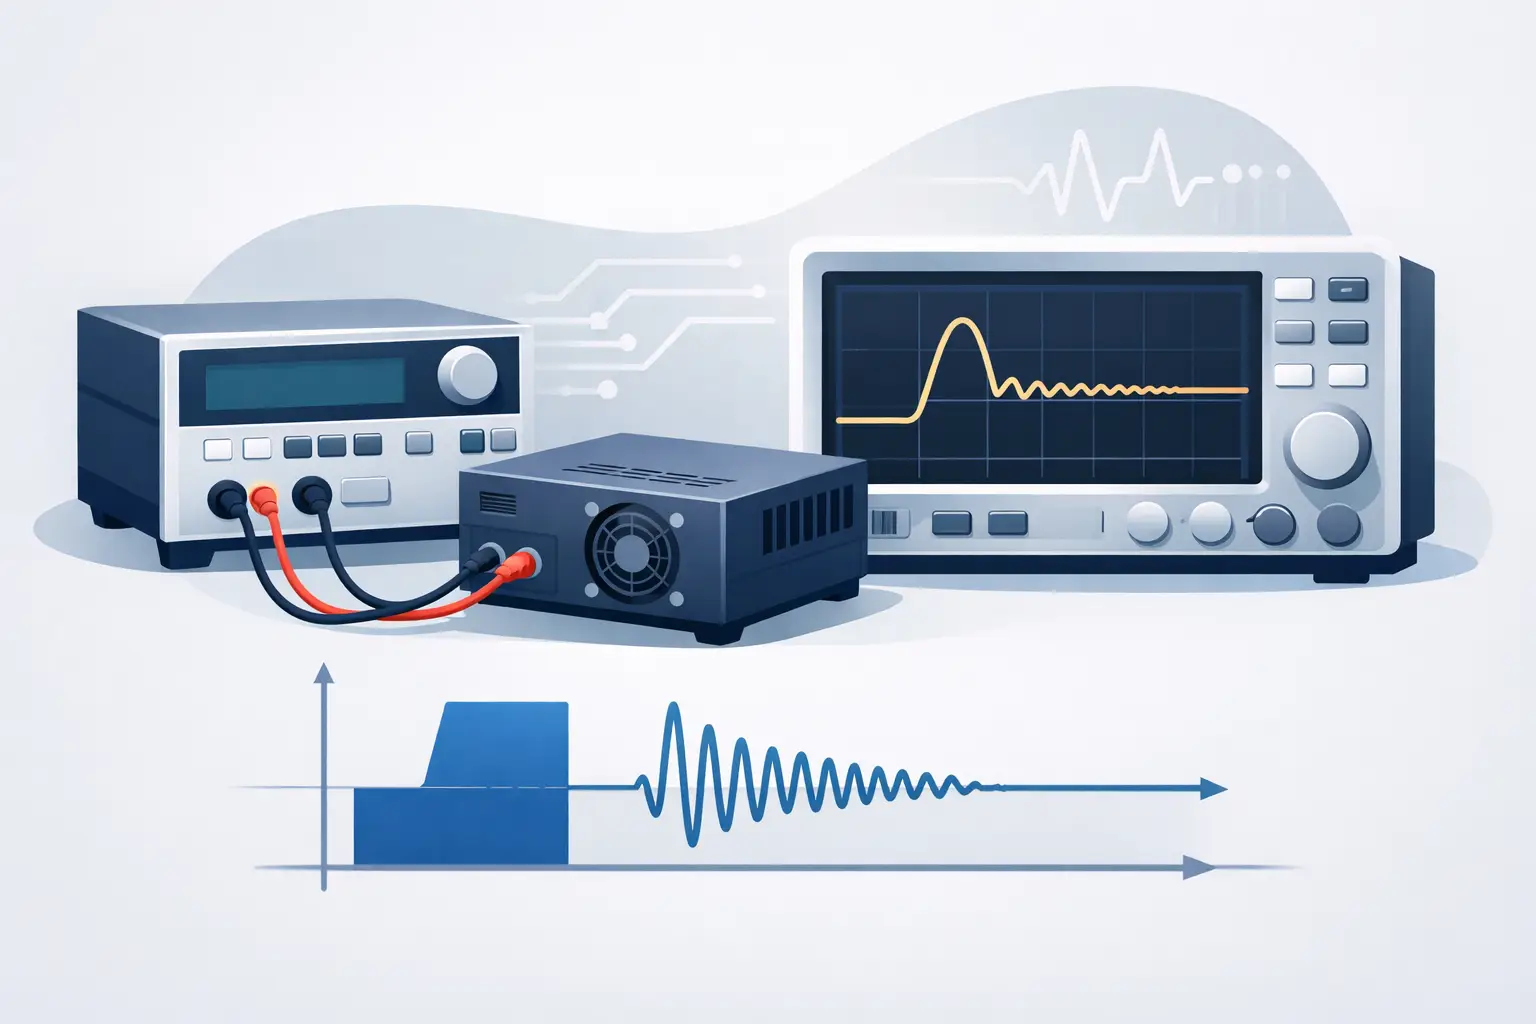
For PWM outputs, distinguish between the fundamental-frequency measurement path and the switching-frequency measurement path. A power analyzer may accurately calculate fundamental power and low-order harmonic content using appropriate filtering and synchronization, while a high-speed digitizer can provide the time-domain fidelity needed to inspect edge behavior, ringing, dead time, and common-mode events. Treating both tasks as one measurement often creates unnecessary uncertainty.
Sampling and synchronization determine spectral credibility
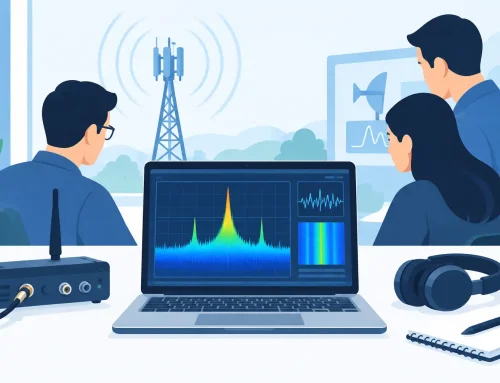
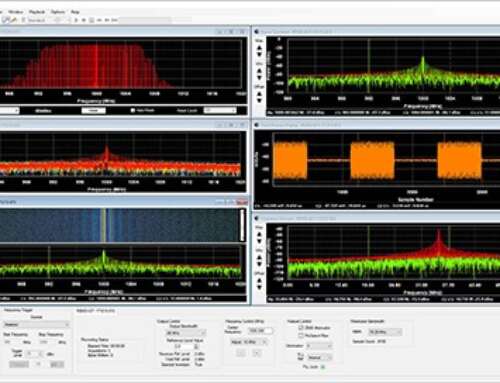
FFT-based harmonic results are only as reliable as the acquired record. If the acquisition window does not contain an integer number of fundamental cycles, spectral leakage can spread energy into neighboring frequency bins. Window functions can reduce leakage, but they also affect amplitude interpretation and resolution. Coherent sampling, when practical, provides a cleaner basis for repeatable harmonic measurements.
Frequency drift introduces another complication. An inverter operating from an unstable source, or producing a variable output frequency, may not remain aligned with a fixed analysis window. Instruments that track the fundamental frequency and maintain synchronized voltage and current channels can improve repeatability. The setup should also document the measurement duration, update rate, averaging method, harmonic grouping, and any filters enabled during the test.
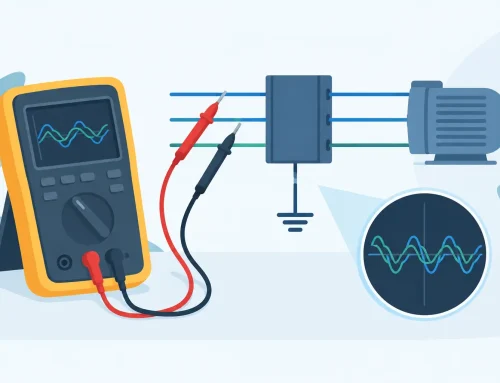
Timing alignment is especially important for power measurements. A small phase error between voltage and current channels can cause significant error at low power factor, even when individual channel amplitude accuracy appears acceptable. For multi-phase inverter testing, channel-to-channel synchronization and phase accuracy should be evaluated as carefully as basic voltage and current range selection.
Build the test setup around the actual inverter boundary
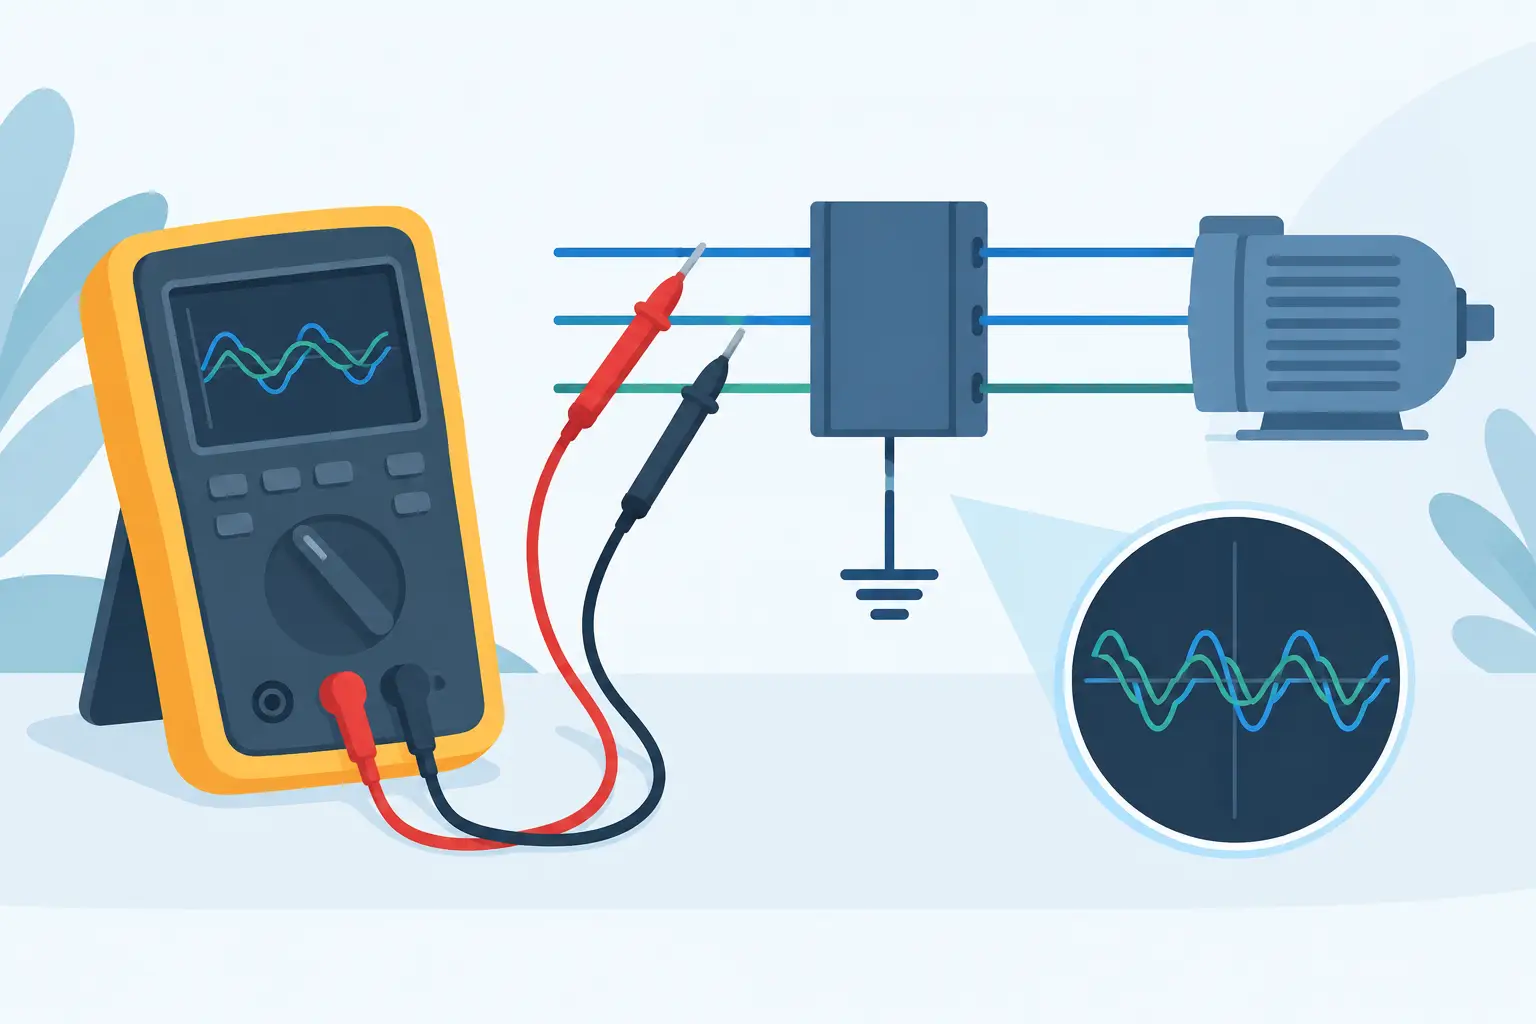
The physical measurement point determines what the data means. At an inverter input, voltage and current measurements characterize DC-bus ripple, input power, and upstream loading. At a grid connection, they characterize the interaction with the AC system. At the output of a motor inverter, they capture the PWM voltage delivered to the cable and motor. These are related behaviors, not equivalent measurements.
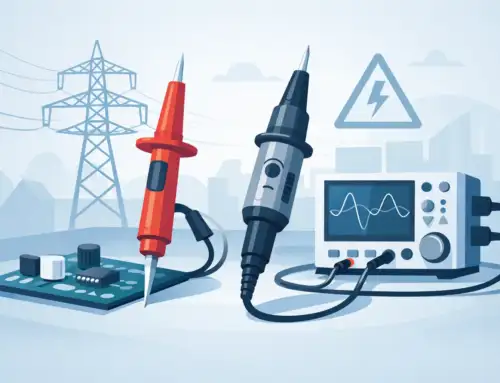
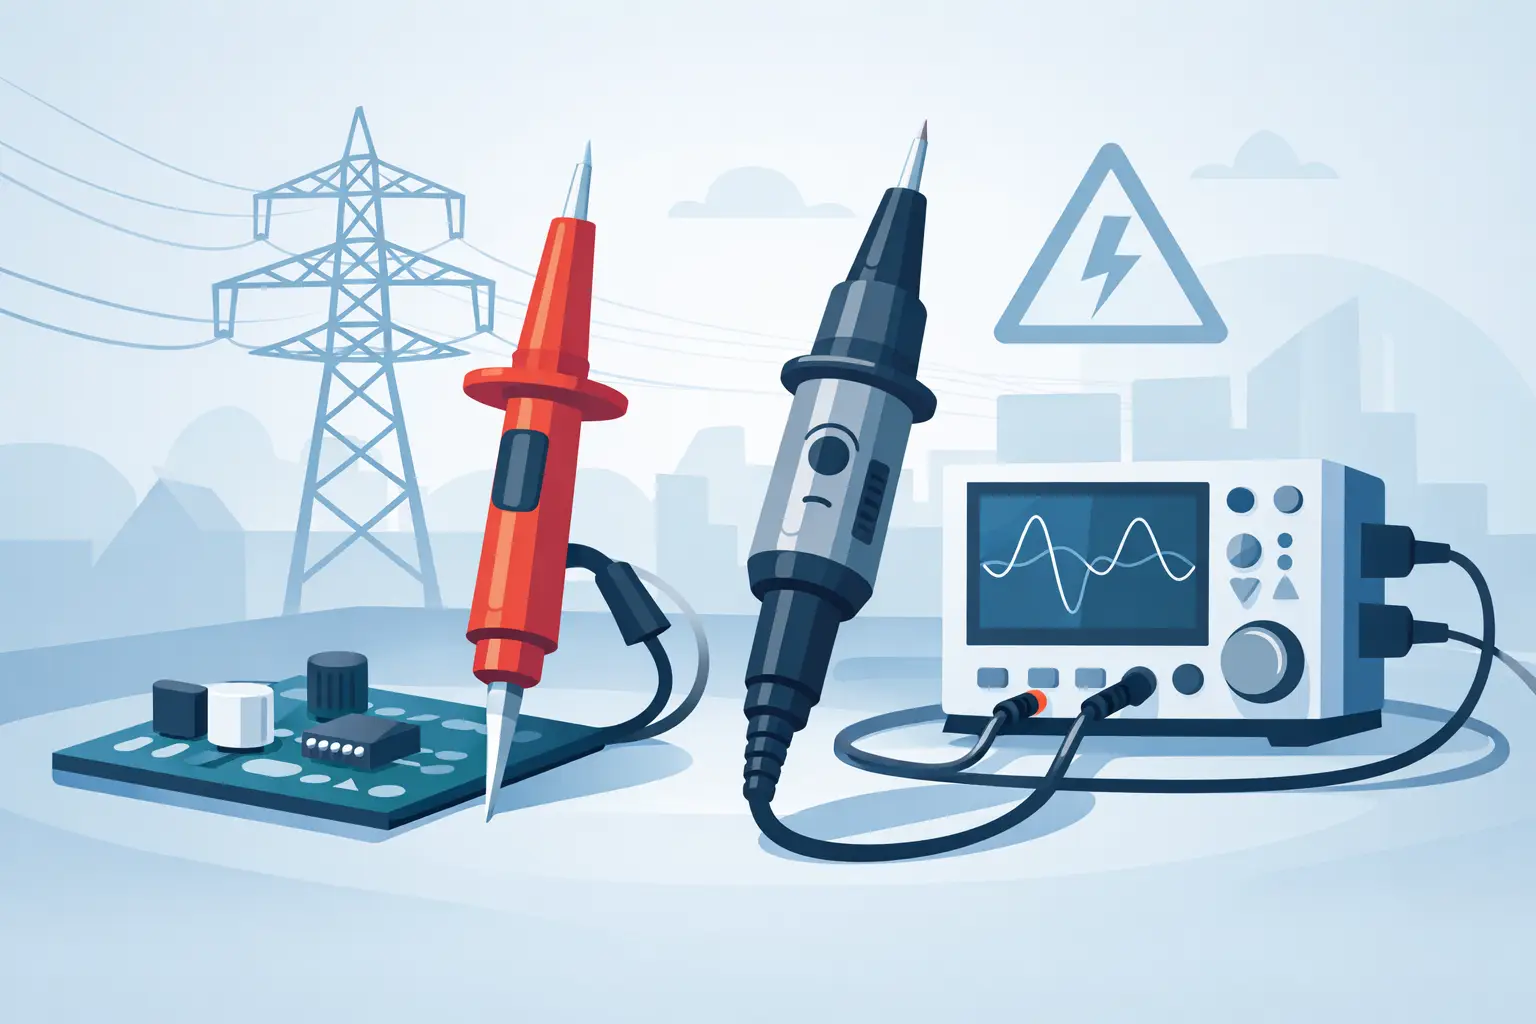
Select voltage probes, current shunts, current transformers, or current probes for the expected amplitude, bandwidth, common-mode voltage, and safety category. A probe that is adequate at 60 Hz may have unacceptable amplitude or phase response near the switching frequency. Likewise, a current transducer can saturate, exhibit bandwidth roll-off, or introduce offset that affects RMS and harmonic calculations.
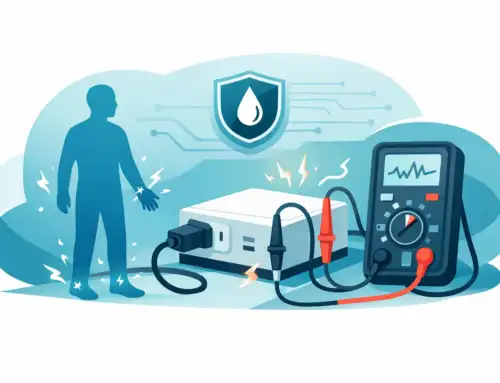
Common-mode conditions deserve particular attention. High dv/dt switching nodes can exceed the practical limits of improperly connected grounded probes and create safety hazards or misleading waveforms. Differential measurement methods with appropriate voltage rating, common-mode rejection, and probe bandwidth are generally required for floating inverter outputs. Verify the entire measurement chain, including leads, connectors, sensors, instrument inputs, and grounding arrangement.
A controlled load is also essential. Resistive loads simplify initial characterization, but they do not represent every application. Motors, transformers, batteries, and grid simulators each introduce different impedance, resonance, and control interactions. Test teams should record load type and operating point with every harmonic dataset so results can be reproduced and compared.
A practical workflow for repeatable results
Begin by defining the decision that the measurement must support. Is the goal to verify a harmonic-current limit, compare filter designs, validate motor-drive efficiency, locate resonance, or investigate field failures? That objective establishes the required frequency range and acceptance criteria.
Next, characterize the operating condition. Record DC input, AC source characteristics, output frequency, switching frequency, load, temperature, control mode, and any active filter settings. A spectrum without this context has limited diagnostic value.
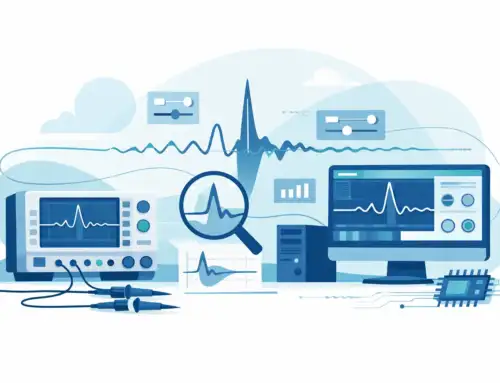
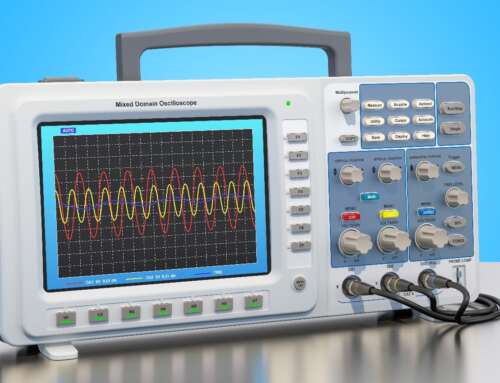
Configure the instrument for the expected voltage and current ranges, then confirm sensor polarity and channel phase alignment. Capture a time-domain record before relying on calculated values. Time-domain inspection often exposes clipping, probe ringing, current-probe offset, unexpected discontinuous conduction, or modulation artifacts that a single THD number can conceal.
Then apply the selected harmonic analysis method and retain the configuration with the result. Report the fundamental magnitude, individual harmonic components, THD or other distortion metric, frequency range, averaging interval, and measurement uncertainty where required. For formal compliance work, include the standard edition, test arrangement, source impedance or grid simulator settings, and relevant operating modes.
Finally, repeat measurements at the conditions most likely to challenge the inverter. Full load is not always the worst case. Light-load operation, startup, regenerative transitions, low DC-bus voltage, high temperature, and changes in switching frequency can all produce materially different distortion signatures.
Interpreting results without oversimplifying them
A high low-order harmonic level can point to modulation limitations, control-loop tuning, source imbalance, insufficient filtering, or a load-related interaction. Harmonics clustered near the switching frequency and its sidebands can indicate PWM behavior, resonant circuits, cable effects, or filter design limitations. Interharmonics may arise from variable-frequency operation, frequency conversion, control interactions, or measurement-window issues.
Correlation is the fastest route to a useful diagnosis. Compare spectra while changing one controlled variable at a time: switching frequency, load, DC-bus voltage, filter configuration, or control algorithm. Simultaneously observe voltage, current, real power, reactive power, and DC-bus behavior. The pattern of change is usually more informative than an isolated spectrum.
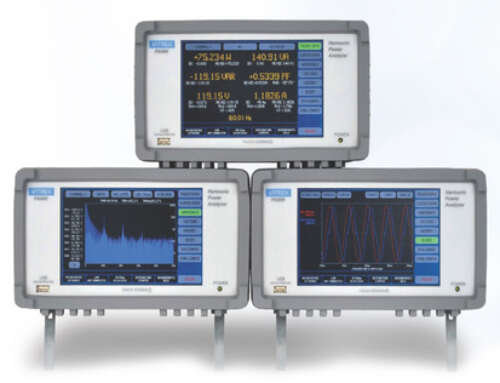
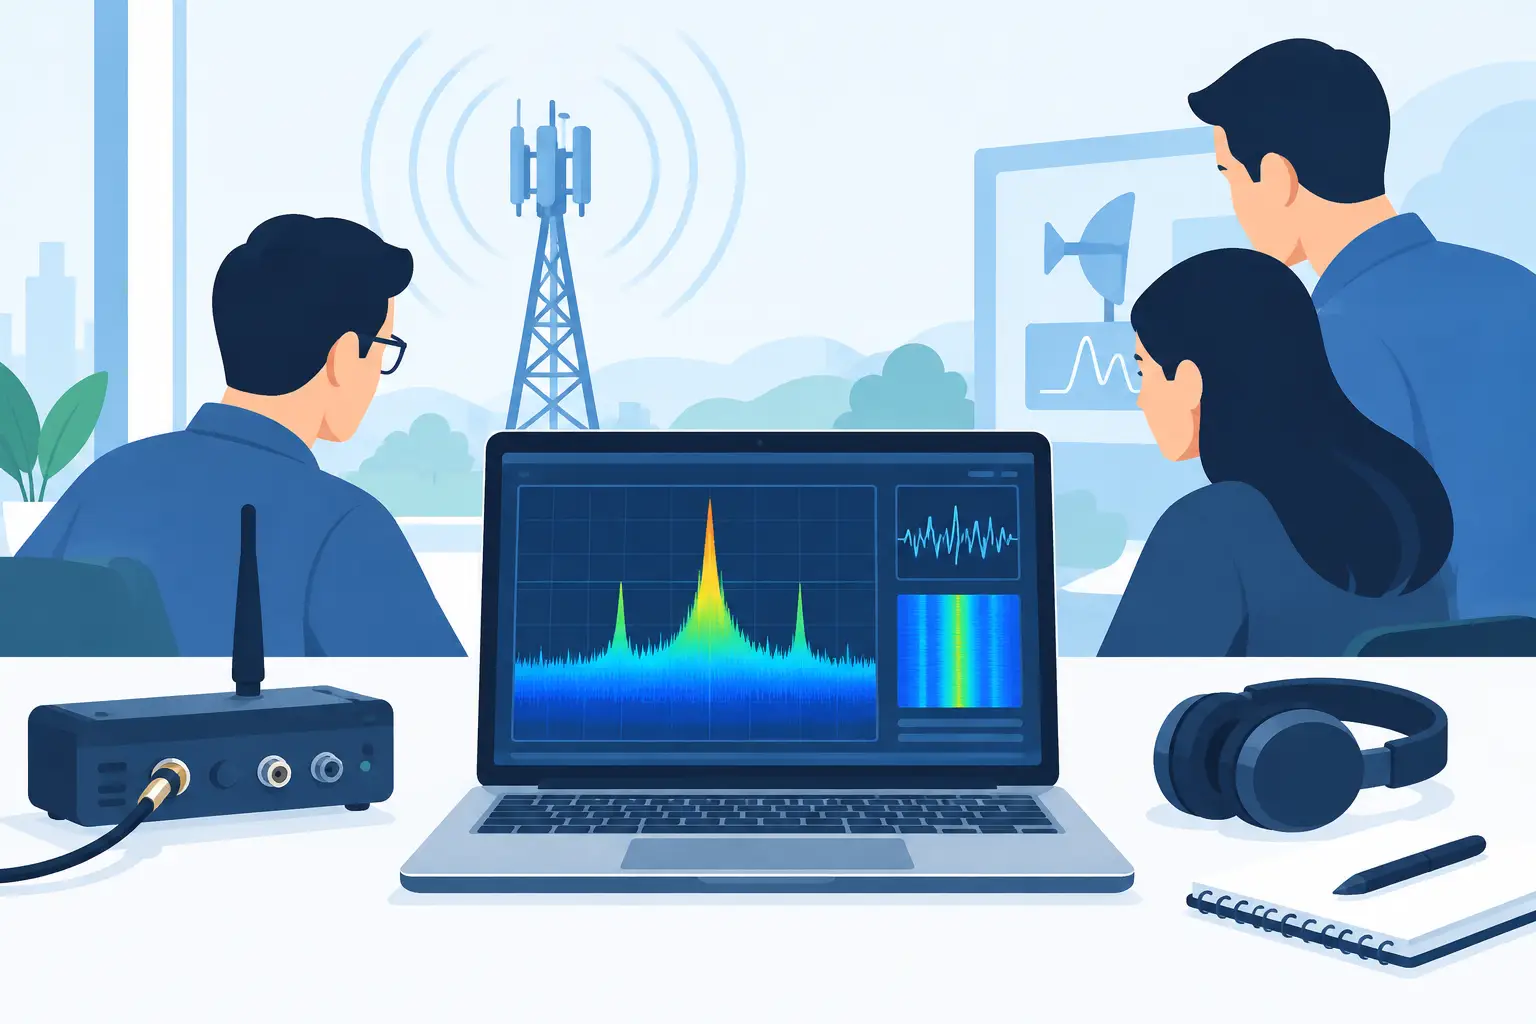
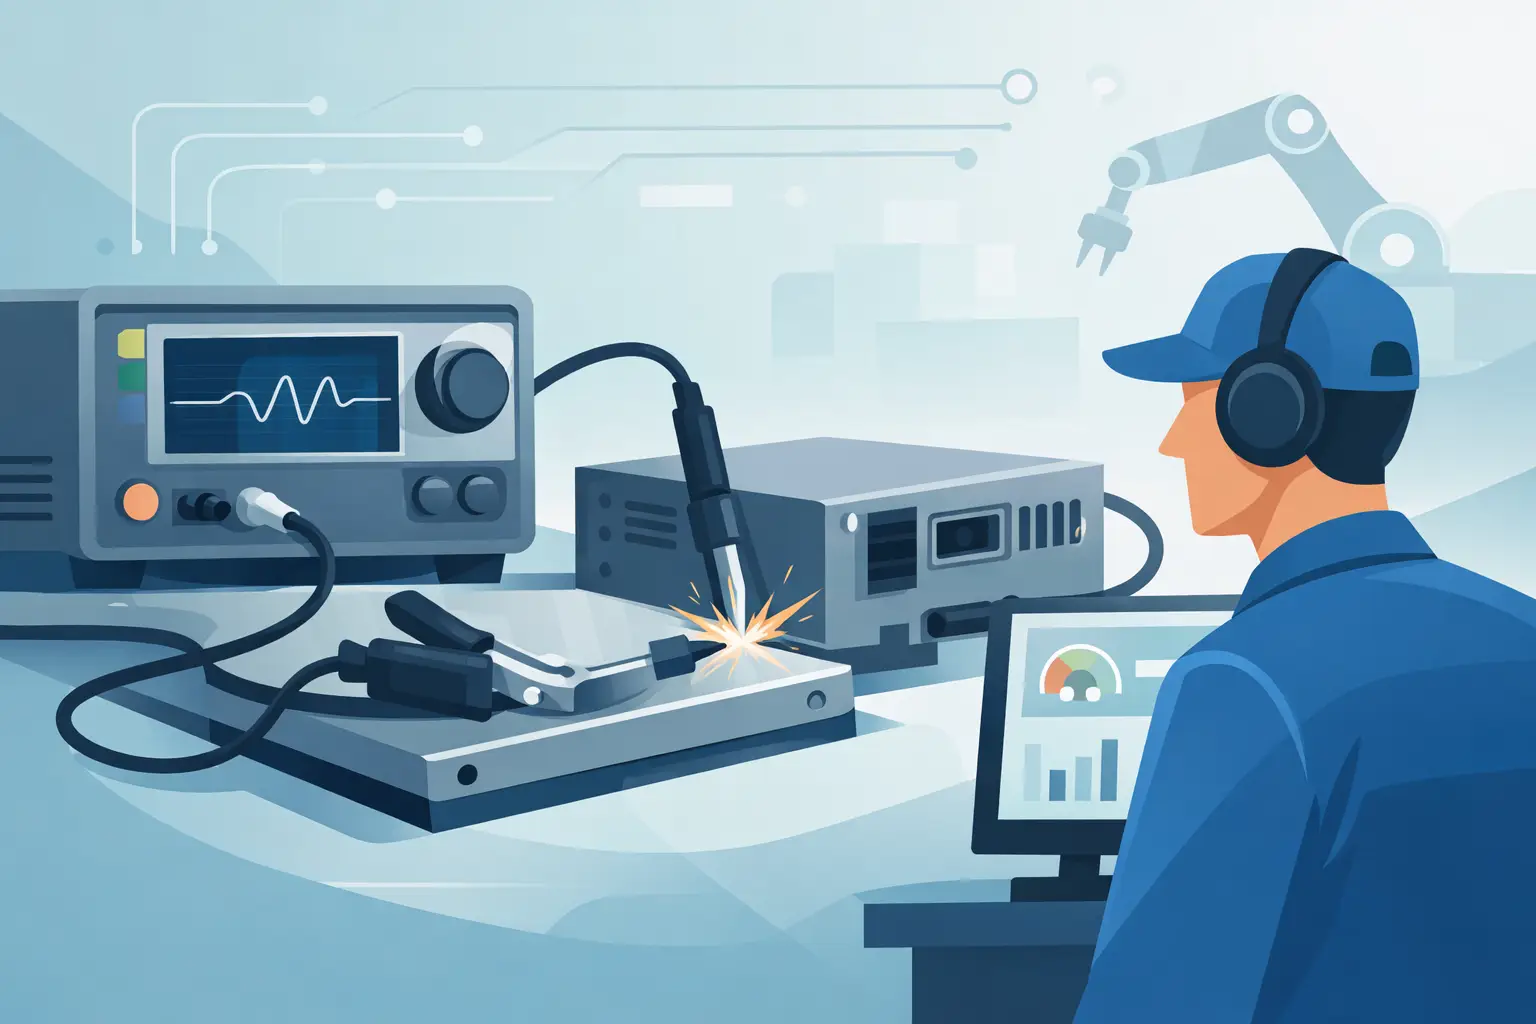
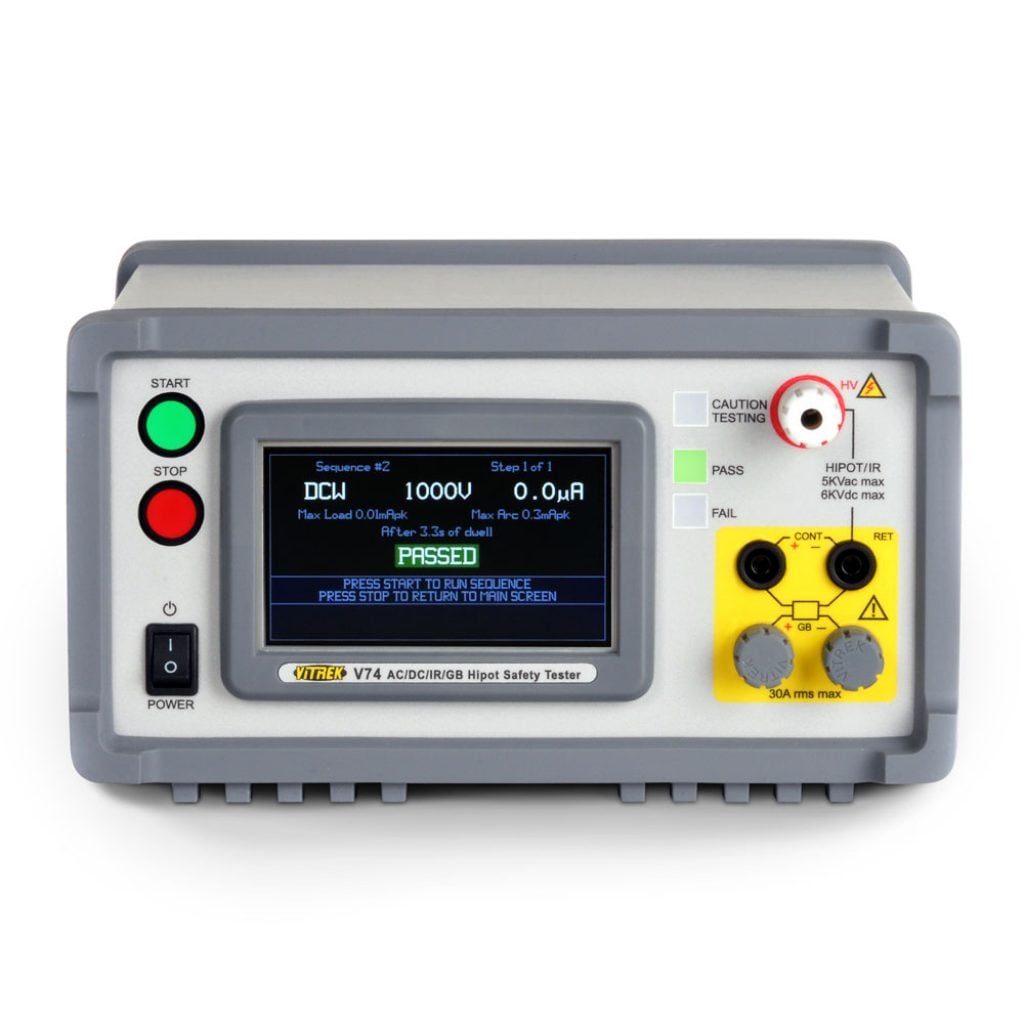
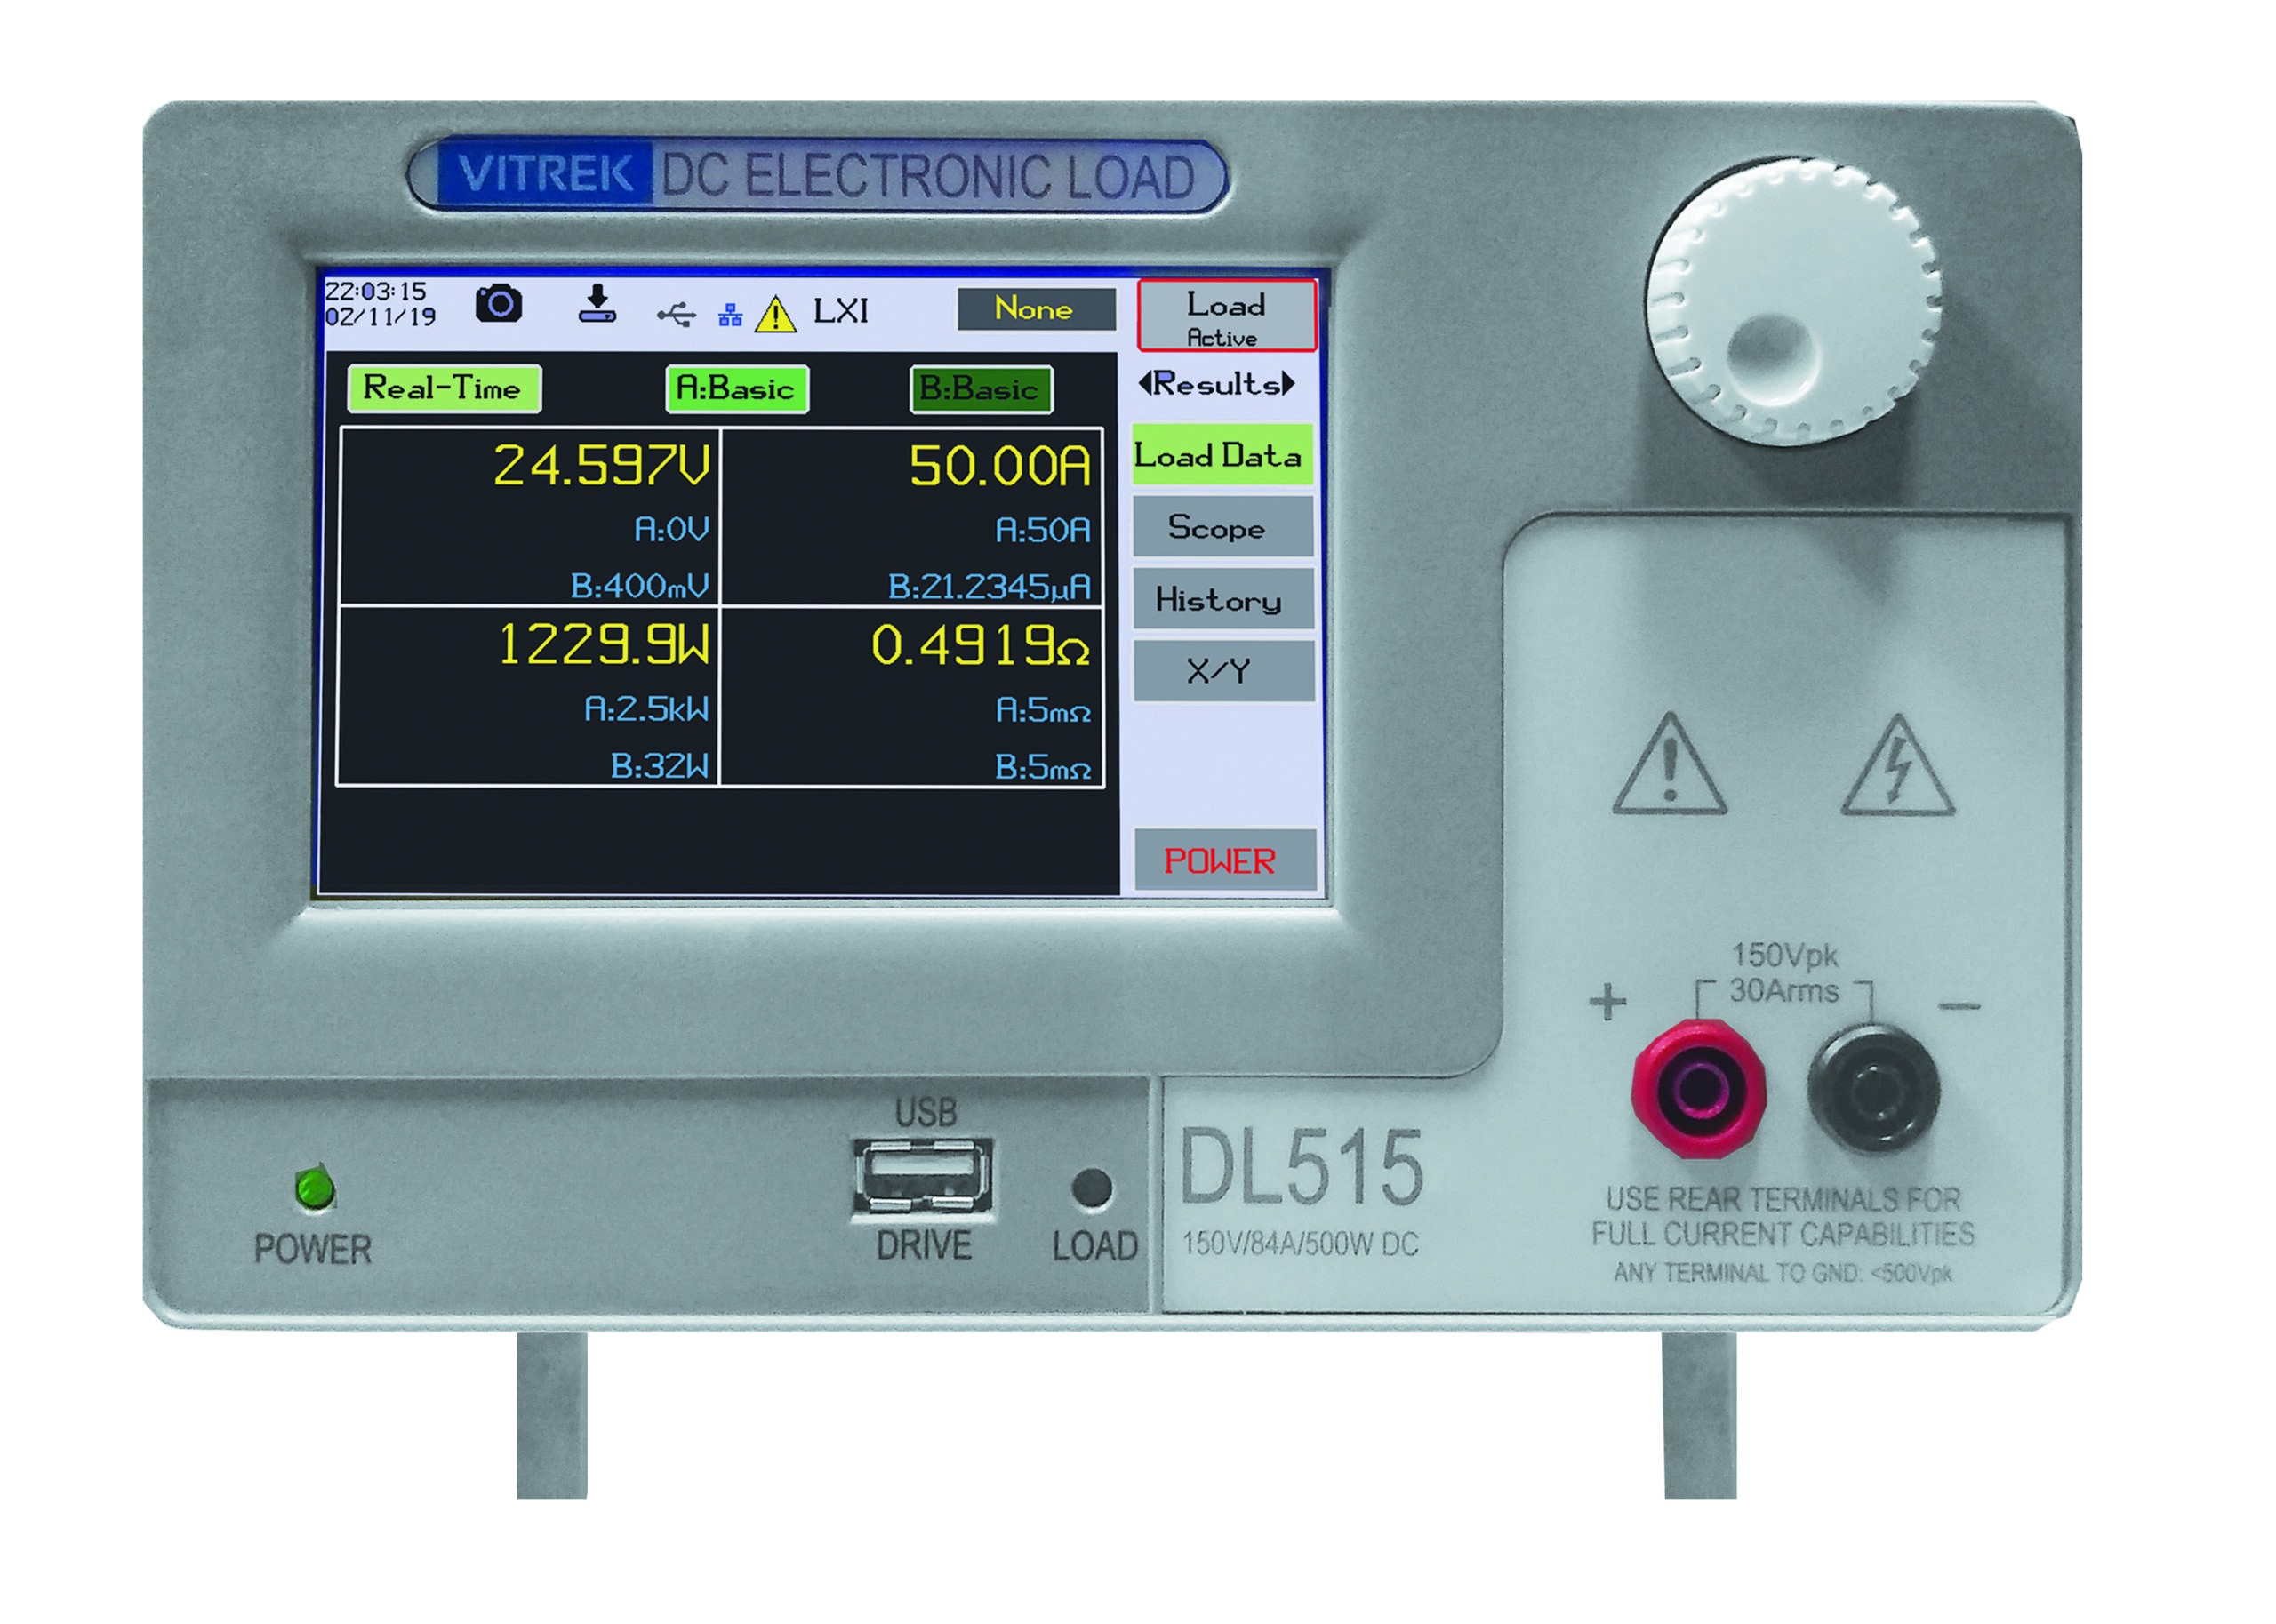
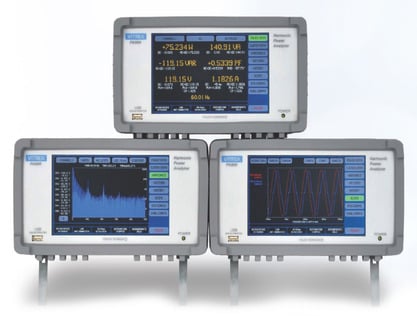
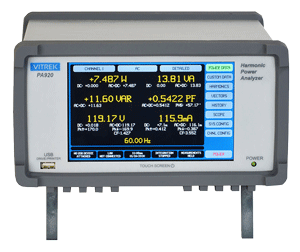
Precision power analyzers and synchronized data-acquisition systems provide complementary evidence in this work. A power analyzer supports accurate electrical quantities and harmonic calculations, while high-speed waveform capture can explain the switching events behind those results. Vitrek measurement platforms are designed for applications where both repeatable electrical data and traceable test configuration matter.
The most useful harmonic measurement is one that survives review: the operating condition is documented, the instrument bandwidth is justified, sensors are appropriate for the waveform, and the reported metric matches the requirement. When those controls are in place, harmonic data becomes more than a pass-fail number. It becomes a practical engineering tool for improving inverter performance before distortion becomes a reliability, compliance, or field-service problem.