A bearing rarely fails without giving a measurable warning. The challenge is that its early defect signatures can be small, intermittent, and easily masked by normal machine vibration. Knowing how to monitor bearing vibration means building a measurement process that captures the right signal, at the right location, often enough to distinguish a developing fault from normal operating variation.
For critical rotating assets, a single overall vibration reading is not a condition-monitoring program. Reliable decisions require repeatable sensor mounting, suitable frequency coverage, machine-speed reference data, and trends that account for load, temperature, and operating state. This is particularly relevant in aerospace test stands, production equipment, EV drivetrains, pumps, compressors, machine tools, and other systems where an unplanned bearing failure can damage adjacent components or interrupt qualified processes.
Start With the Failure Modes You Need to Detect
Rolling-element bearings generate different vibration patterns depending on the fault mechanism. A localized defect on the outer race, inner race, rolling element, or cage creates periodic impacts. Lubrication problems, contamination, improper preload, misalignment, and looseness can raise vibration before a discrete defect frequency becomes dominant.
The monitoring method should reflect the expected failure mode and the consequence of failure. A low-speed, heavily loaded bearing may require different sensing and analysis than a high-speed motor bearing. Early-stage defects often excite high-frequency structural resonances, while advanced damage produces more visible harmonics and elevated overall vibration at lower frequencies.
Start by documenting bearing part numbers, shaft speed ranges, bearing geometry when available, lubrication method, normal load conditions, and the machine’s drive arrangement. This information enables calculation of bearing fault frequencies and prevents analysts from confusing a bearing signature with a gear-mesh, belt, fan-blade, electrical, or structural resonance issue.
Select the Measurement Quantity and Sensor
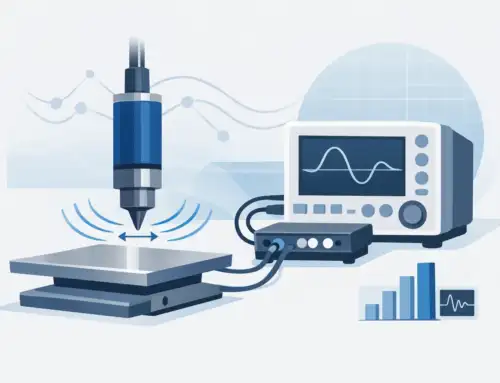
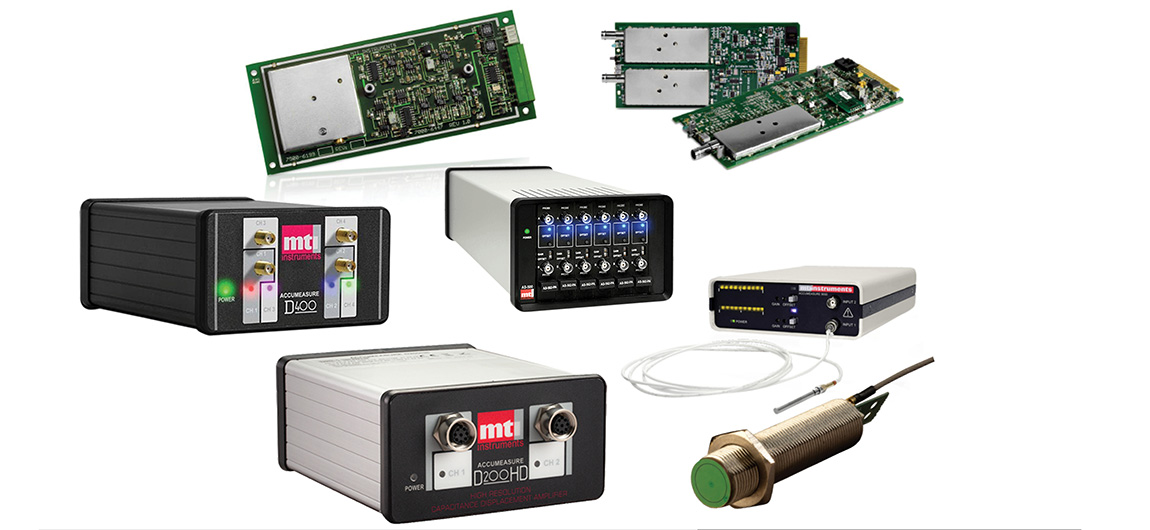
Acceleration is generally the preferred measurement for rolling-element bearing diagnostics because impact events contain substantial high-frequency energy. A piezoelectric accelerometer with adequate bandwidth can capture the impulsive content associated with early bearing damage. For permanent installations, choose industrial sensors, connectors, cabling, and environmental protection appropriate to temperature, contamination, washdown, and electromagnetic conditions.
Velocity measurements are valuable for assessing overall machine condition, especially in the lower-frequency range where imbalance, misalignment, and looseness are common. Velocity is often expressed in inches per second RMS in US industrial practice. Displacement is most useful for observing shaft motion in fluid-film bearing applications or where non-contact proximity probes are installed. It is not usually the primary choice for detecting early rolling-element bearing faults.
Sensor sensitivity is a trade-off. Higher-sensitivity accelerometers provide better resolution for low-amplitude vibration, but may have lower usable high-frequency range or reduced tolerance for severe vibration. Lower-sensitivity sensors can be better suited to high-energy machines or shock-prone applications. Confirm the sensor’s frequency response, dynamic range, mounting requirements, and calibration status before treating its output as decision-grade data.
How to Monitor Bearing Vibration at the Right Location
Mount the accelerometer on a stiff load path as close as practical to the bearing housing. The preferred direction is usually radial, since most rolling-element bearing forces transmit strongly through the radial housing structure. Horizontal and vertical measurements can reveal different structural responses, so two radial directions are often appropriate on critical machines. An axial location can help identify misalignment, thrust loading, or axial bearing concerns.
Mounting quality has a direct effect on high-frequency response. Stud mounting on a clean, flat, prepared surface is typically the most repeatable option. Adhesive mounts and magnetic bases can be useful for route-based monitoring, but they may limit frequency response and introduce variability. A hand-held probe is suitable for quick screening, not for comparing subtle high-frequency changes over time.
Use a documented measurement point for every bearing location. Record the sensor orientation, mounting method, measurement direction, instrument settings, and machine operating condition. If the measurement point changes from one collection to the next, trend data can reflect the changed transfer path rather than the health of the bearing.
Set Sampling and Frequency Coverage for the Fault
Sampling rate determines the highest frequency that can be represented without aliasing. For general machine-condition measurements, a lower frequency range may be sufficient. For bearing envelope analysis or high-frequency impact detection, the acquisition system must capture the relevant resonant band and provide appropriate anti-alias filtering.
A practical configuration begins with the expected bearing frequencies and the machine’s resonant response. The fundamental bearing defect frequencies are normally multiples of shaft speed and depend on bearing geometry. They include ball pass frequency outer race, ball pass frequency inner race, ball spin frequency, and fundamental train frequency. Their harmonics and sidebands frequently provide more diagnostic value than a single peak.
The record length also matters. Longer records improve frequency resolution, which helps separate close-running orders or identify sidebands around a defect frequency. Short records can be adequate for broadband overall values, but they can obscure low-frequency detail. For variable-speed machines, collect tachometer or encoder data when possible. Order tracking can then separate speed-related content from fixed-frequency structural signals.
Use More Than One Analysis View
Overall RMS vibration is useful as a screening metric, but it is insensitive to some early bearing faults. Combine it with spectral and time-domain analysis. A time waveform can reveal repetitive impacts, clipping, looseness, or transient events that a spectrum averages away. An FFT spectrum identifies frequency components and harmonics. High-frequency enveloping, also called demodulation, extracts periodic impact repetition rates from a resonance band and is often one of the most effective tools for early rolling-element bearing diagnosis.
Trending is more reliable than evaluating a single reading in isolation. Establish a baseline after commissioning or after a known-good bearing replacement. Then trend overall values, selected spectral bands, envelope levels, bearing fault-frequency amplitudes, and process conditions. A gradual increase in a consistent indicator can justify planned intervention even when an absolute alarm threshold has not been crossed.
For critical assets, compare vibration data with temperature, lubrication analysis, motor current, torque, process load, and maintenance history. These measurements do not replace vibration analysis, but they strengthen the diagnosis. For example, rising envelope energy accompanied by grease contamination evidence is more actionable than either condition alone.
Build Alarm Limits Around the Machine, Not a Generic Number
Generic vibration limits can provide an initial reference, but they are not a substitute for machine-specific baselines. ISO 20816 offers a framework for evaluating machine vibration, while ISO 13373 provides guidance for condition monitoring and diagnostics. Their application depends on machine type, power, support stiffness, measurement location, and operating state.
Set alert and alarm levels using historical baseline data, known failure progression, and asset criticality. A statistically based alert may flag a meaningful departure from normal behavior. A higher alarm level should trigger a defined response, such as confirmation measurement, inspection, lubrication review, load reduction, or planned replacement. Avoid setting limits so tightly that operators receive repeated nuisance alarms, or so broadly that a progressing fault is ignored.
Alarm logic should also consider speed and load. A machine operating at 40 percent load should not necessarily be compared directly with data gathered at full production load. If variable operating states are unavoidable, maintain separate baselines or use condition-based normalization.
Make the Data Repeatable and Traceable
Measurement integrity depends on more than the sensor. Confirm that the data acquisition system has sufficient channel bandwidth, resolution, input range, and synchronized sampling for the intended analysis. Verify calibration intervals for sensors and instrumentation, and retain calibration records where quality systems, regulated programs, or customer requirements demand traceability.
For permanent systems, inspect cables, connectors, grounds, and enclosure integrity. Intermittent wiring faults can resemble impulsive vibration. For portable routes, use the same instrument setup and acquisition parameters whenever possible. Changes in filters, windowing, averaging, or sensor mounting should be recorded because they can affect trend comparability.
A bearing monitoring program becomes useful when it produces a defensible maintenance decision. Measure close to the bearing, capture enough bandwidth for the fault stage you need to see, trend repeatable indicators, and confirm suspected defects with operating context. That discipline turns vibration from a periodic reading into evidence engineers can use to schedule work before a bearing dictates the schedule.