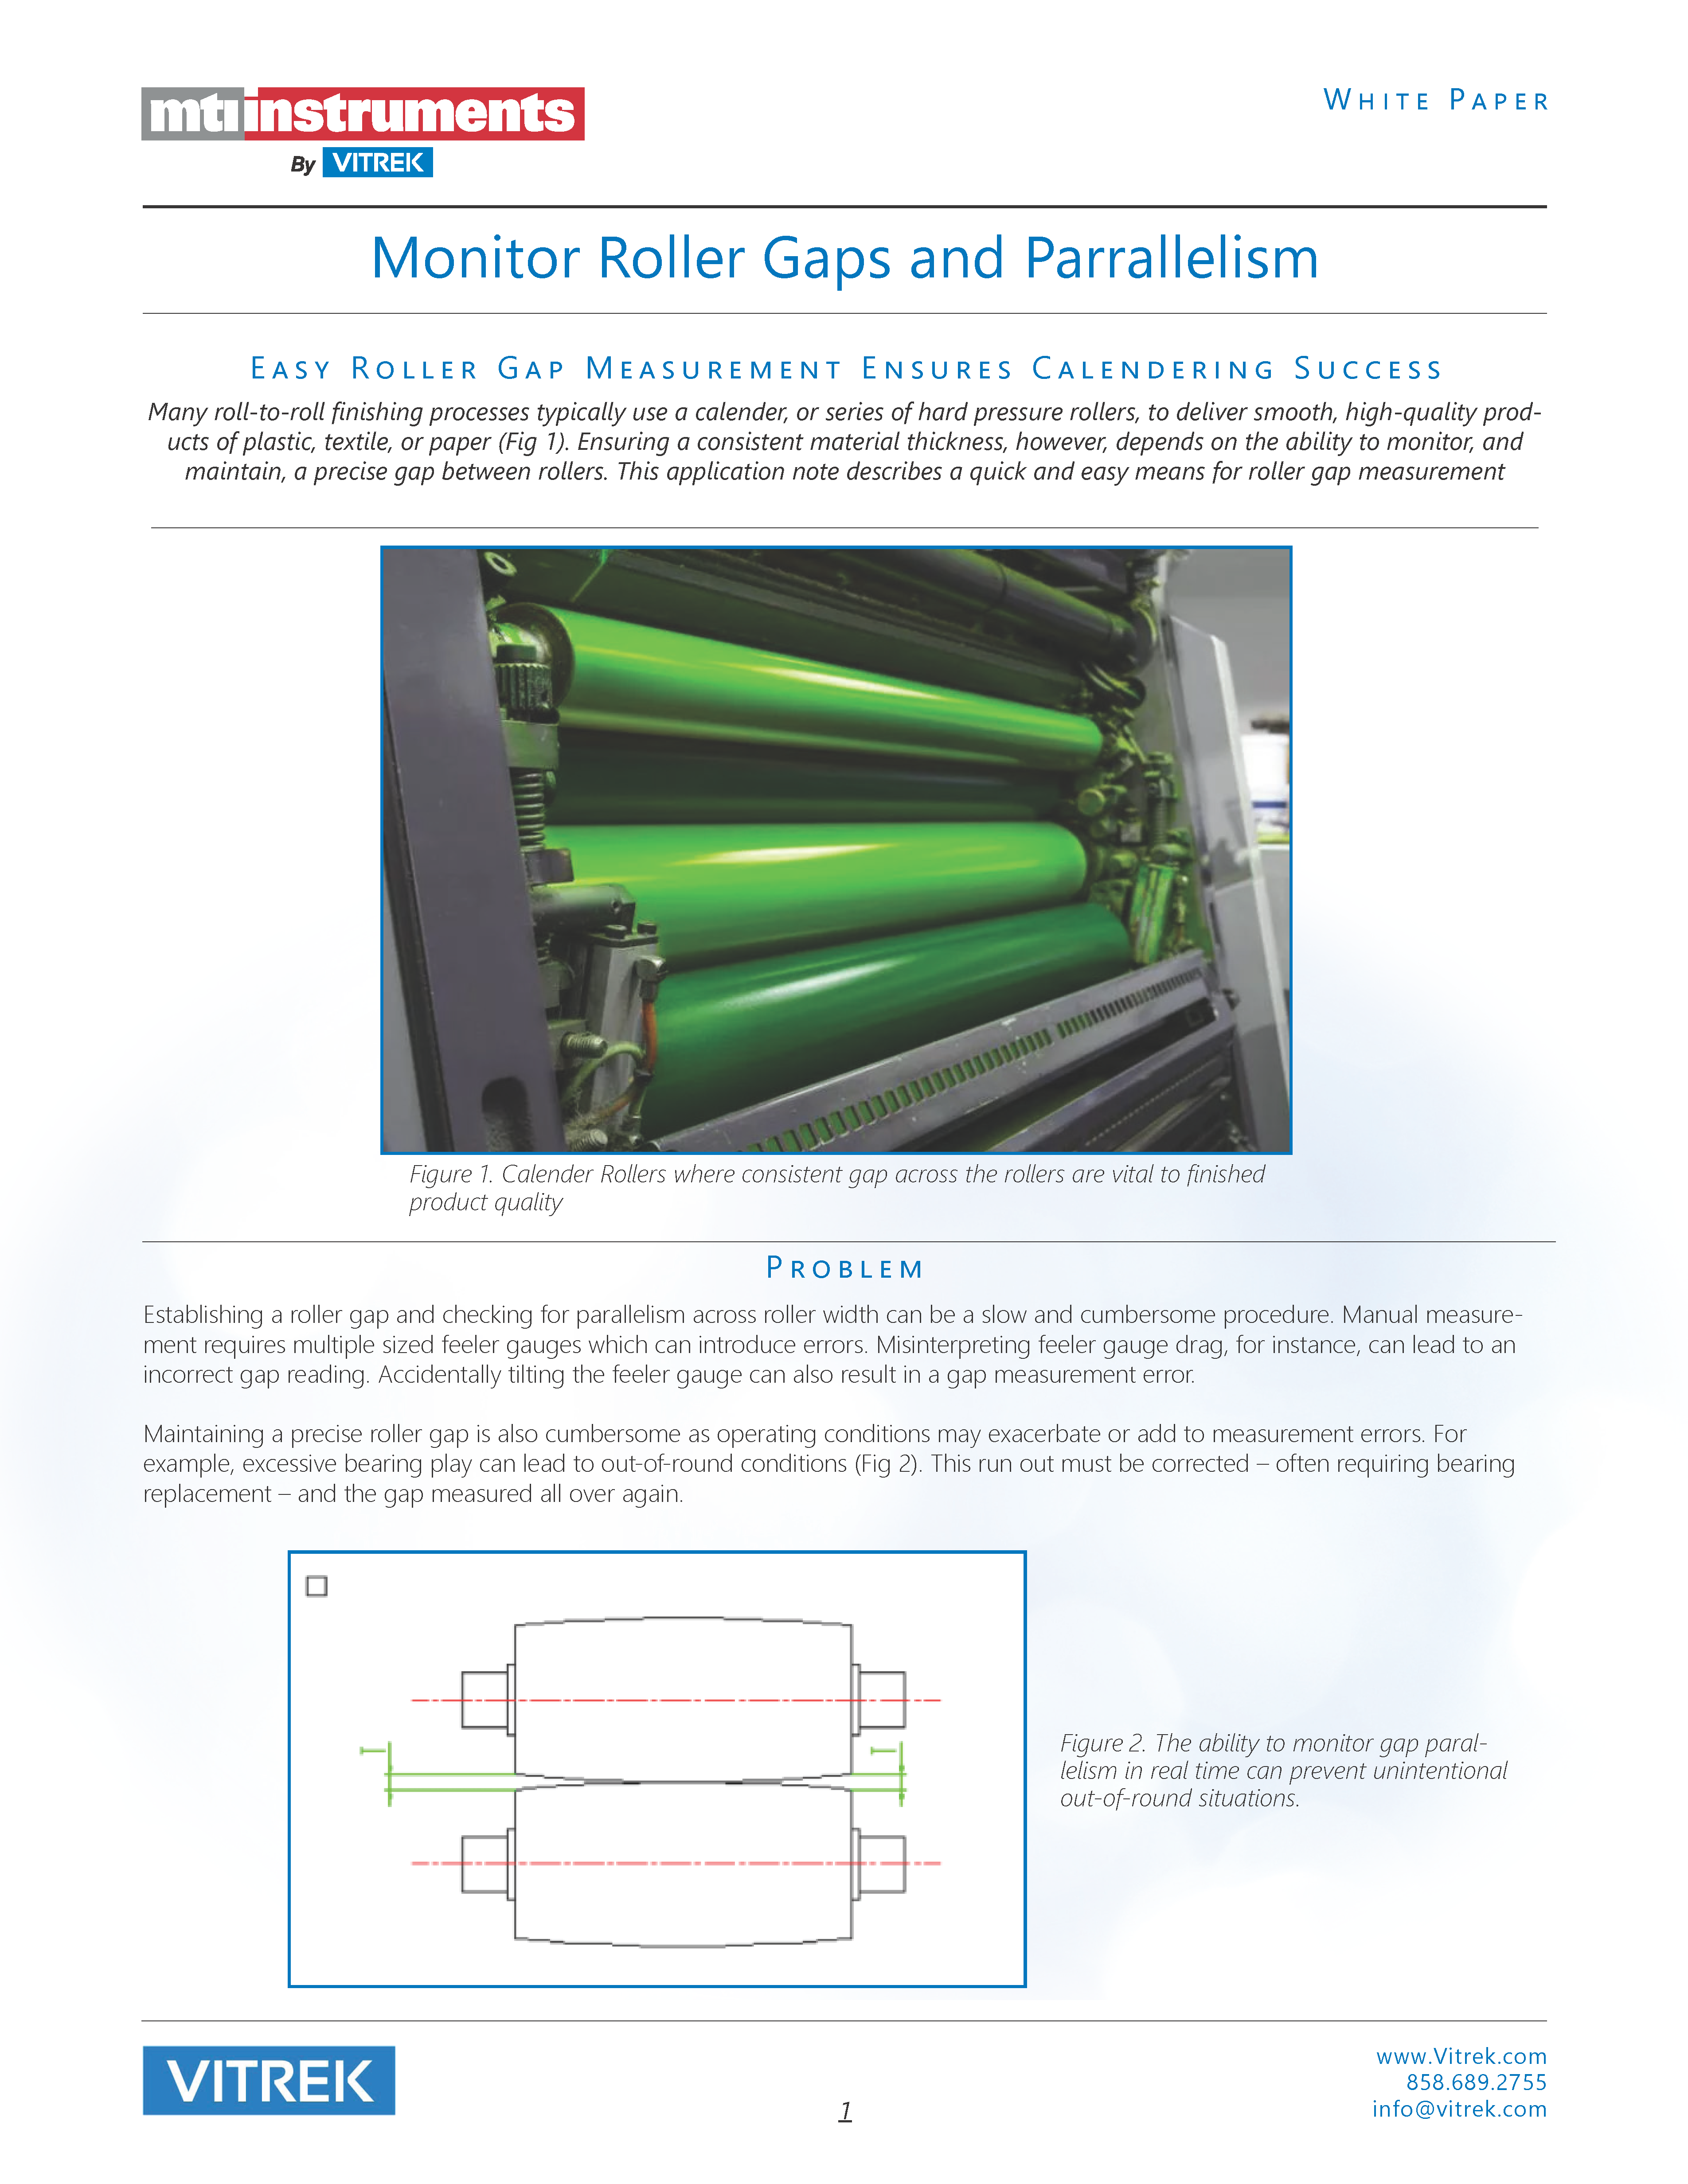
Piezoelectric Stack Motion
Description
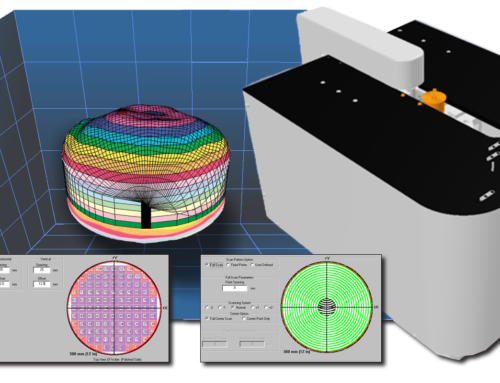
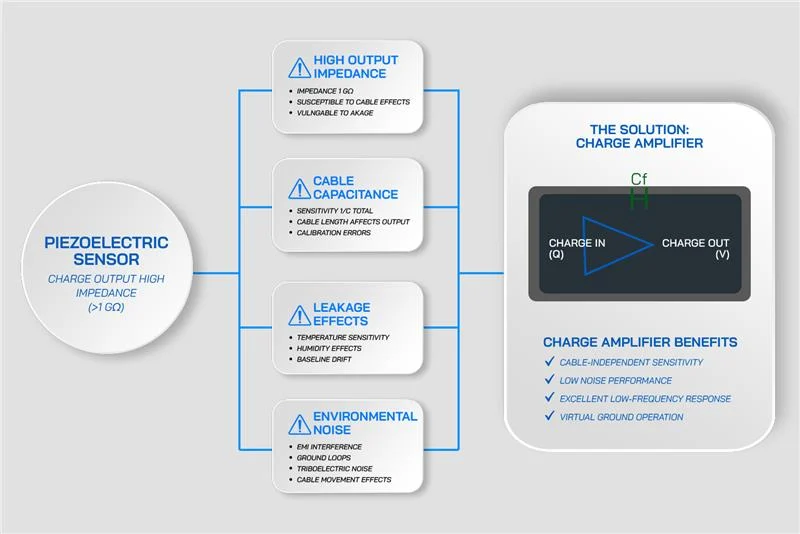
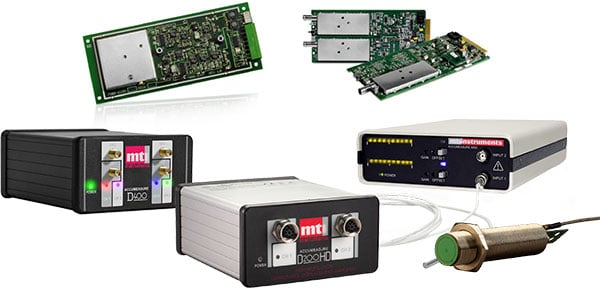
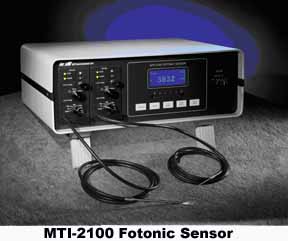
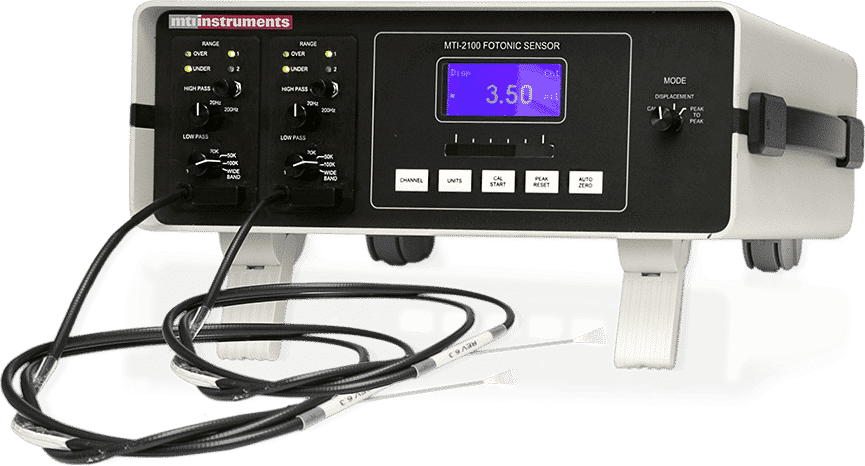
Fotonic sensors are ideal for making dynamic measurement of very small oscillatory motions. Using the MTI-2100 with a spectrum analyzer, angstrom level measurements are possible.
Would you like to know more? Okay let’s set up some basic equipment and get started.
 |
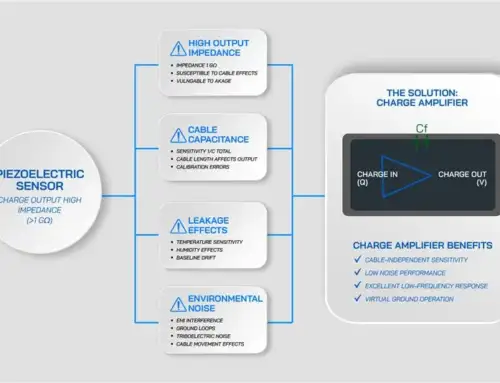
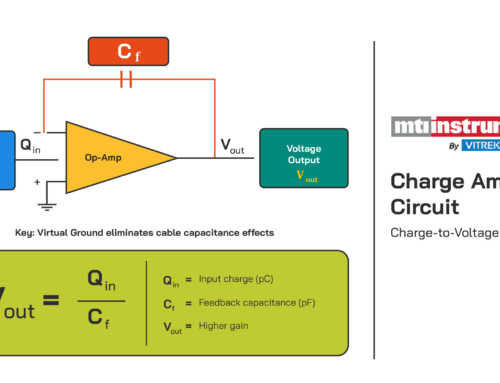
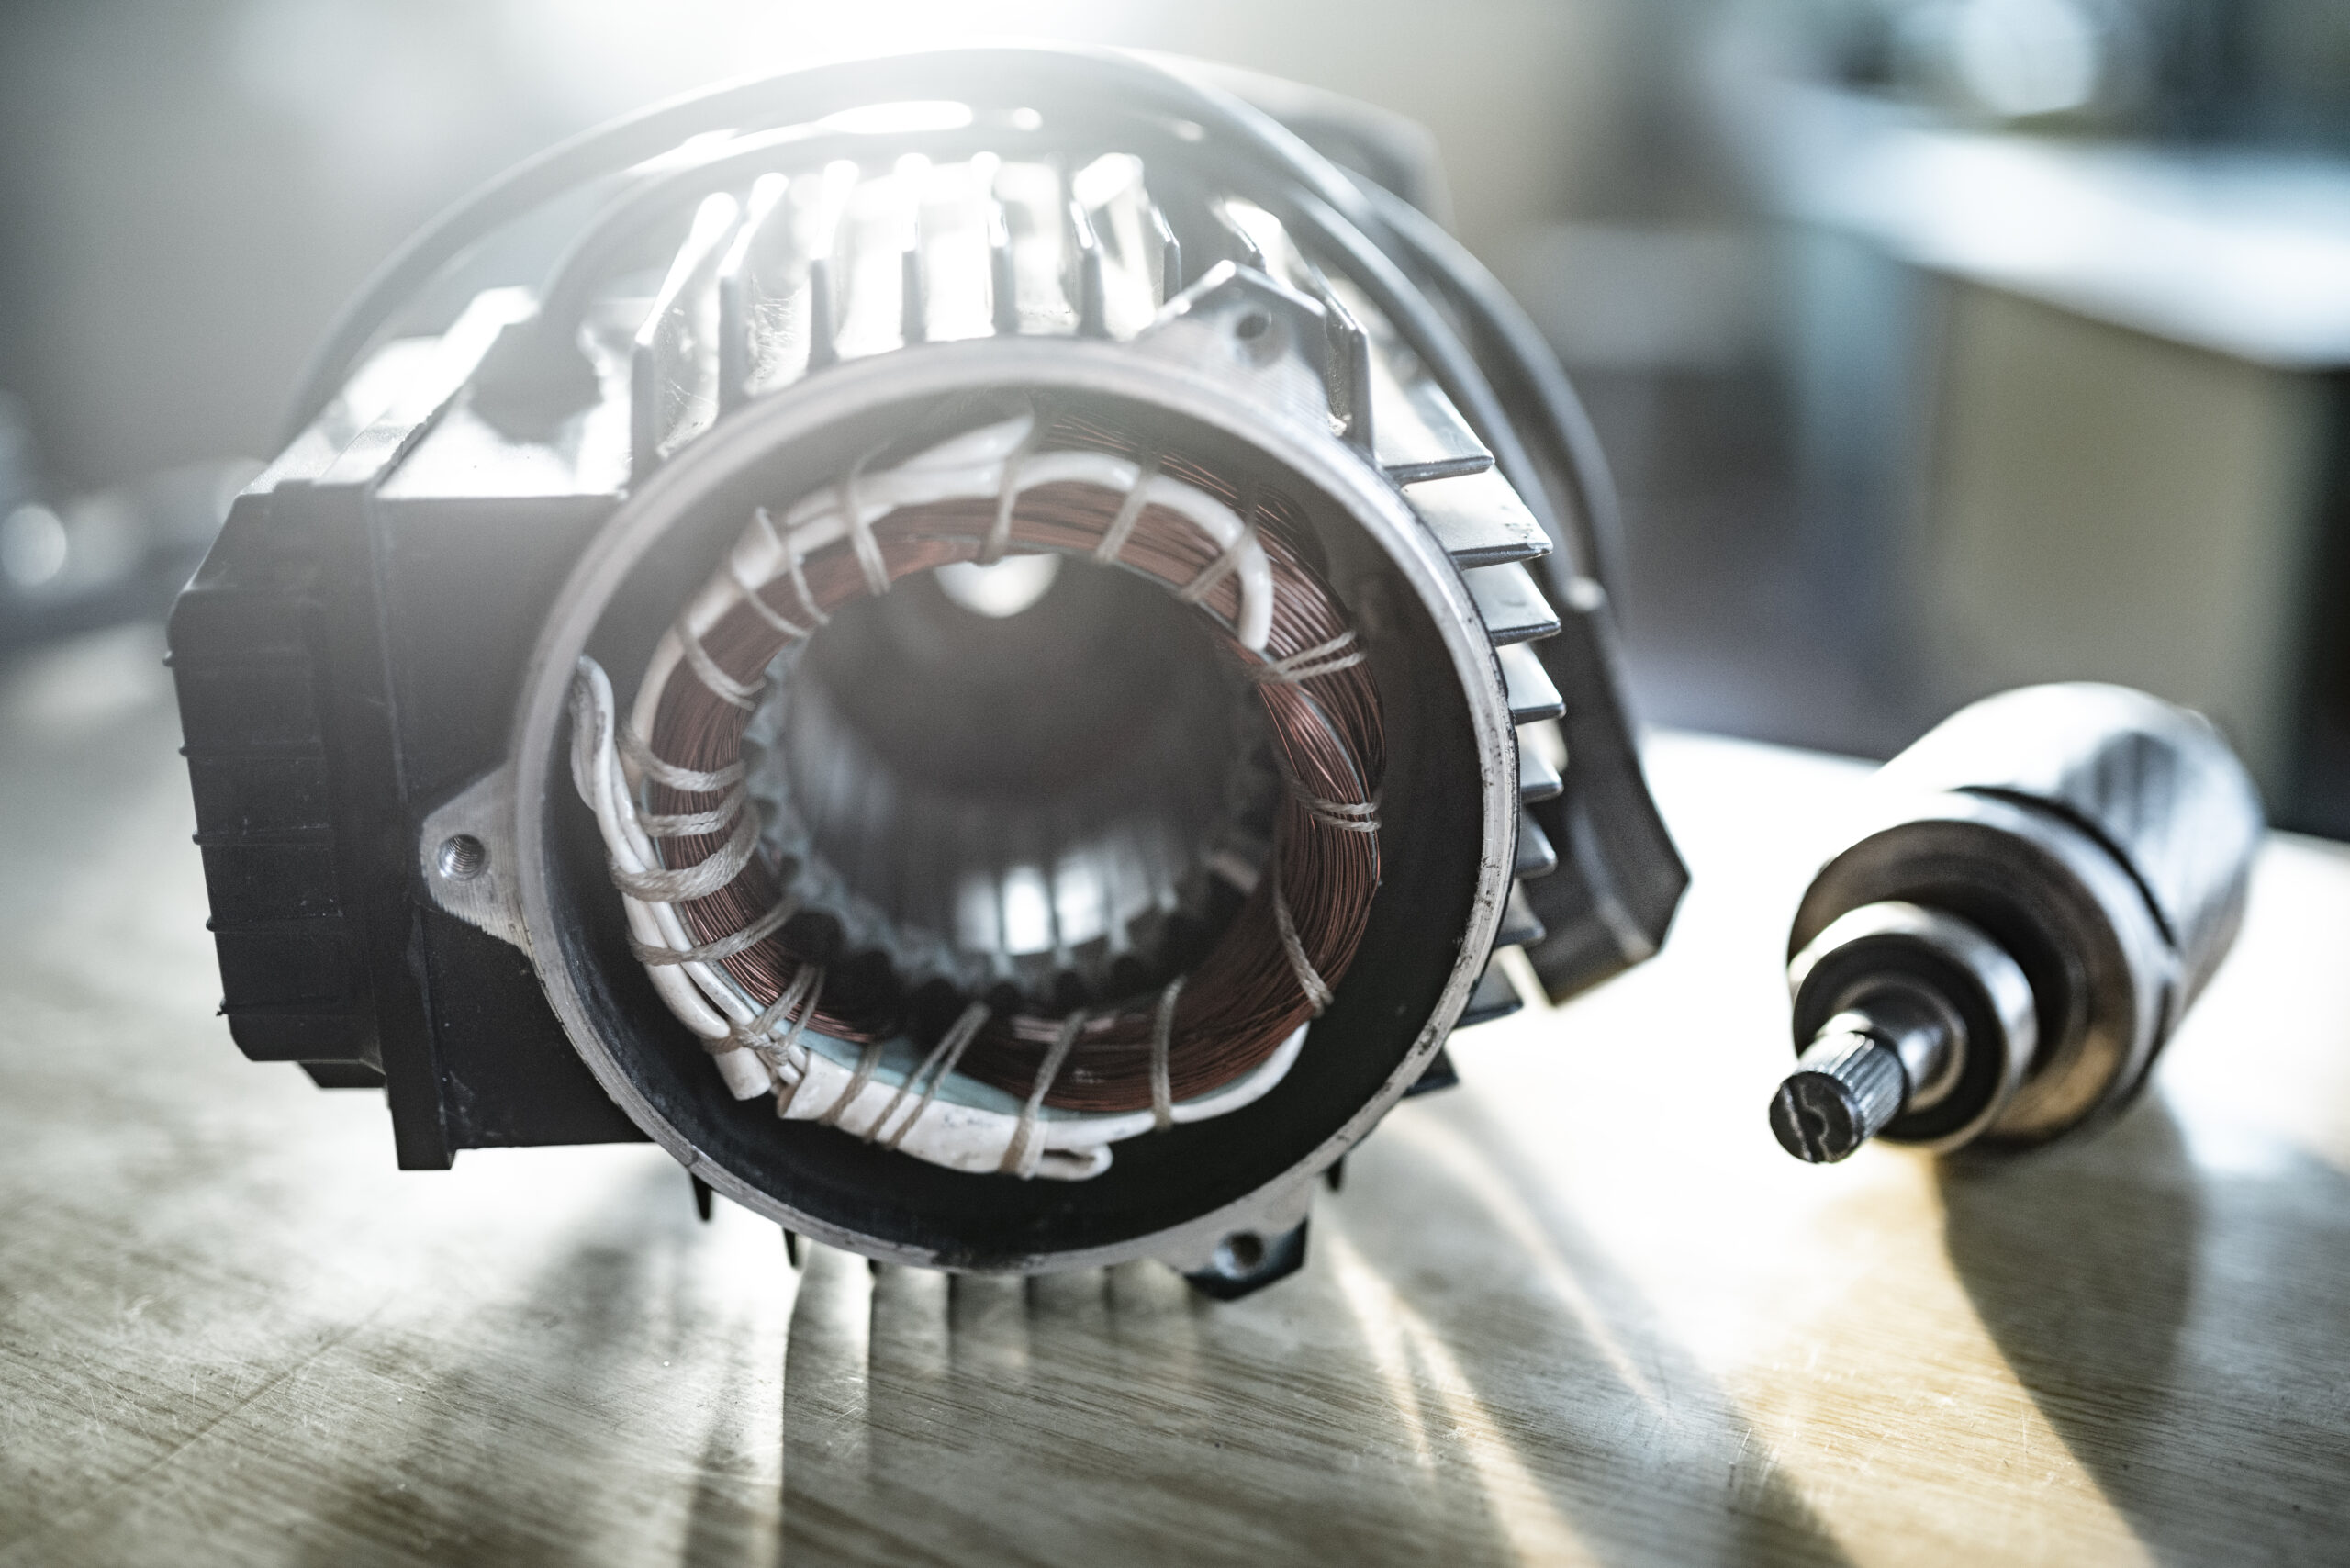
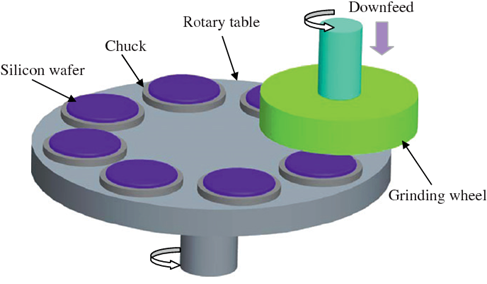
Piezoelectric crystals expand and contract when voltage is applied across the stack. By controlling the amplitude of the applied signal we control the magnitude of the displacement. |
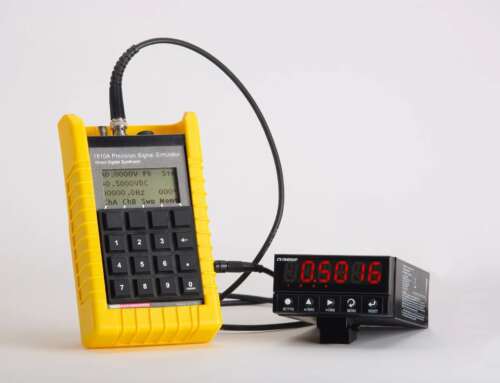
The test setup |
 |
|
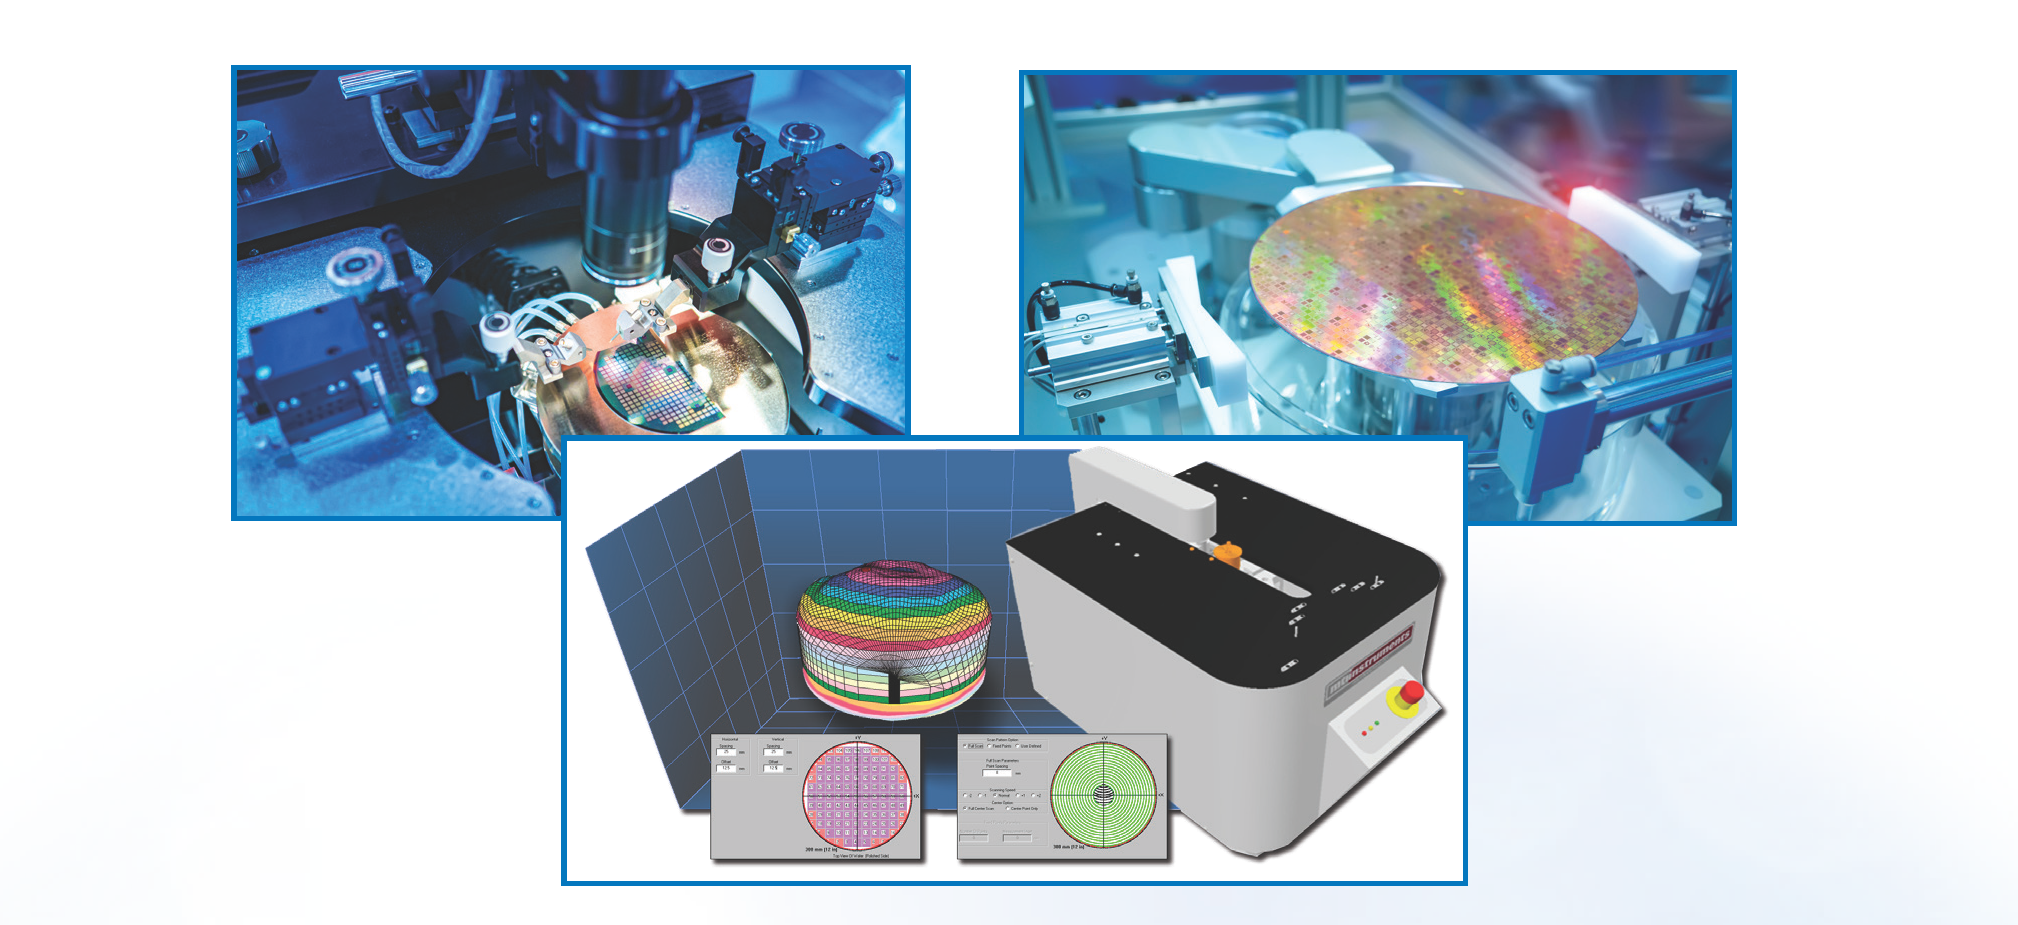
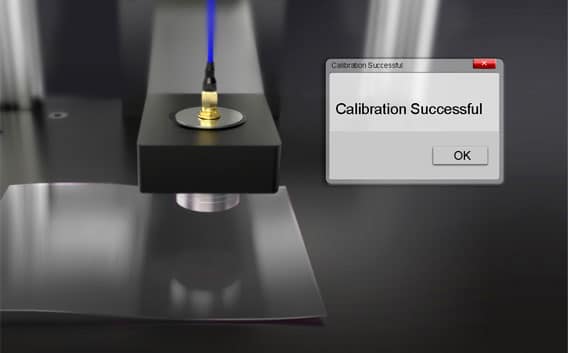
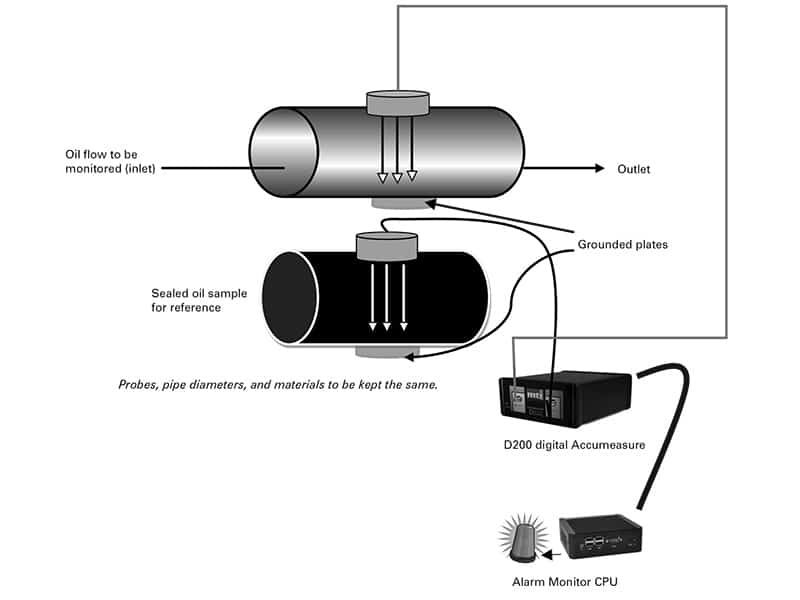
Here we will measure the sinusoidal motion of a small Piezoelectric ceramic transducer being driven by an AC signal generator. The Piezoelectric stack is placed in a fixture to anchor the base of the Piezo stack and with a mounting arm to hold the Fotonic probe over the top of the Piezo stack. We gap the probe at max signal in cal mode (optical peak) and press the calibrate switch on the MTI -2100. This scales the signal up to 10 Volts DC. Then we switch to displacement and reposition the probe towards the stack such that we are in the middle of the range 1 slope anywhere in 2-7 volts region.

In Displacement mode we chose 2.7 volts as an operating position that’s within the R1 linear range. Next we increase the resolution of the signal by pushing the range 2 (10X) switch and adjust the offset pot such that the output signal is not saturated. The sensitivity is increased by 10X because the lamp intensity increases by 10X.
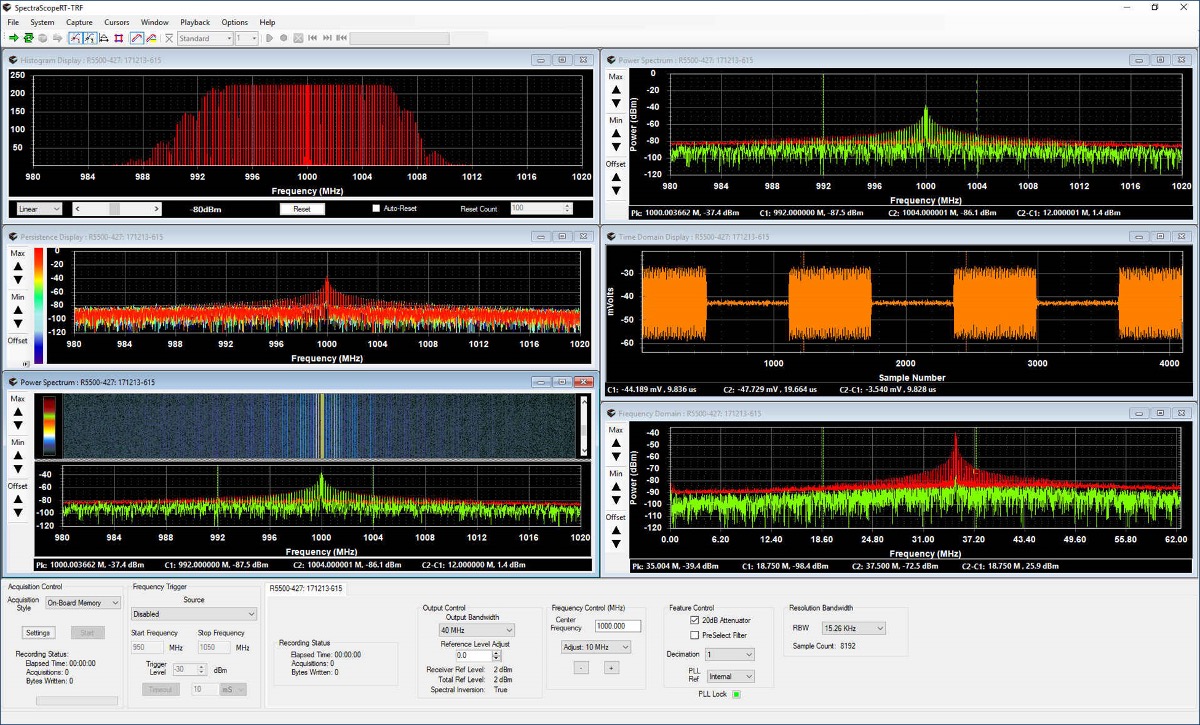
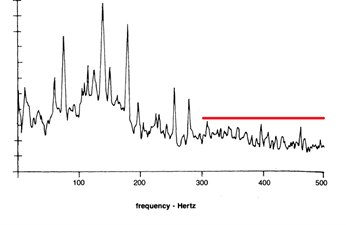
The modules built in high pass filter is set to 20Hz to help reduce seismic motion pickup (bench vibration) and the module’s low pass filter is set to 1 kHz to help reduce noise as we are only looking at a 100 Hz signal. Next a signal generator is connected to the Piezo stack and we set the amplitude to control the peak to peak motion of the Piezo device. To start we set the generator’s amplitude to 26 mV RMS. This makes the amplitude of the Piezo stack 4.5 nanometers p-p. We see this as about 8 mV p-p on the scope Fig 6 and about 4-5 nm pk-pk on the display. Spectrum analyzer showing the 100 Hz signal at an amplitude of 2.8 mV RMS which is about 8mV p-p. Converting this to engineering units (.00057 um /mV from module’s sensitivity factor) we are observing 4.5 nm p-p motion. What is important to note here is that the signal to noise ratio on the spectrum analyzer is quite large. With the bandwidth shown here we could get down to about 200uV rms ~ 0.5 nm resolution! That is 5 angstroms resolution. So using a spectrum analyzer in the frequency domain in conjunction with the MTI-2100 and MTI-2032RX high resolution Fotonic probe allows us to resolve down to angstroms of mechanical motion. The MTI -2100 is able to resolve down to about 1-2 nm with its built in peak to peak display. The module is capable of measuring up to about 100kHz motion.

Conclusion: 


