MTI’s Accumeasure HD Amplifier vs. SmarAct’s PicoScale Interferometer
Description
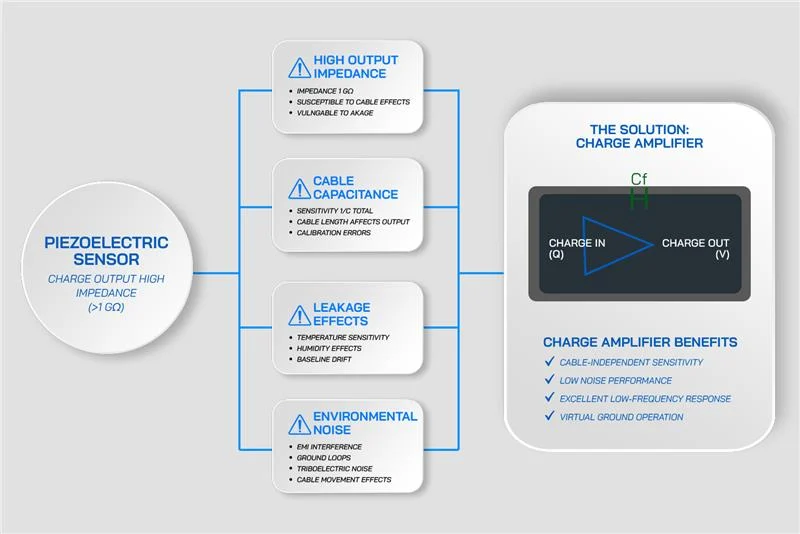
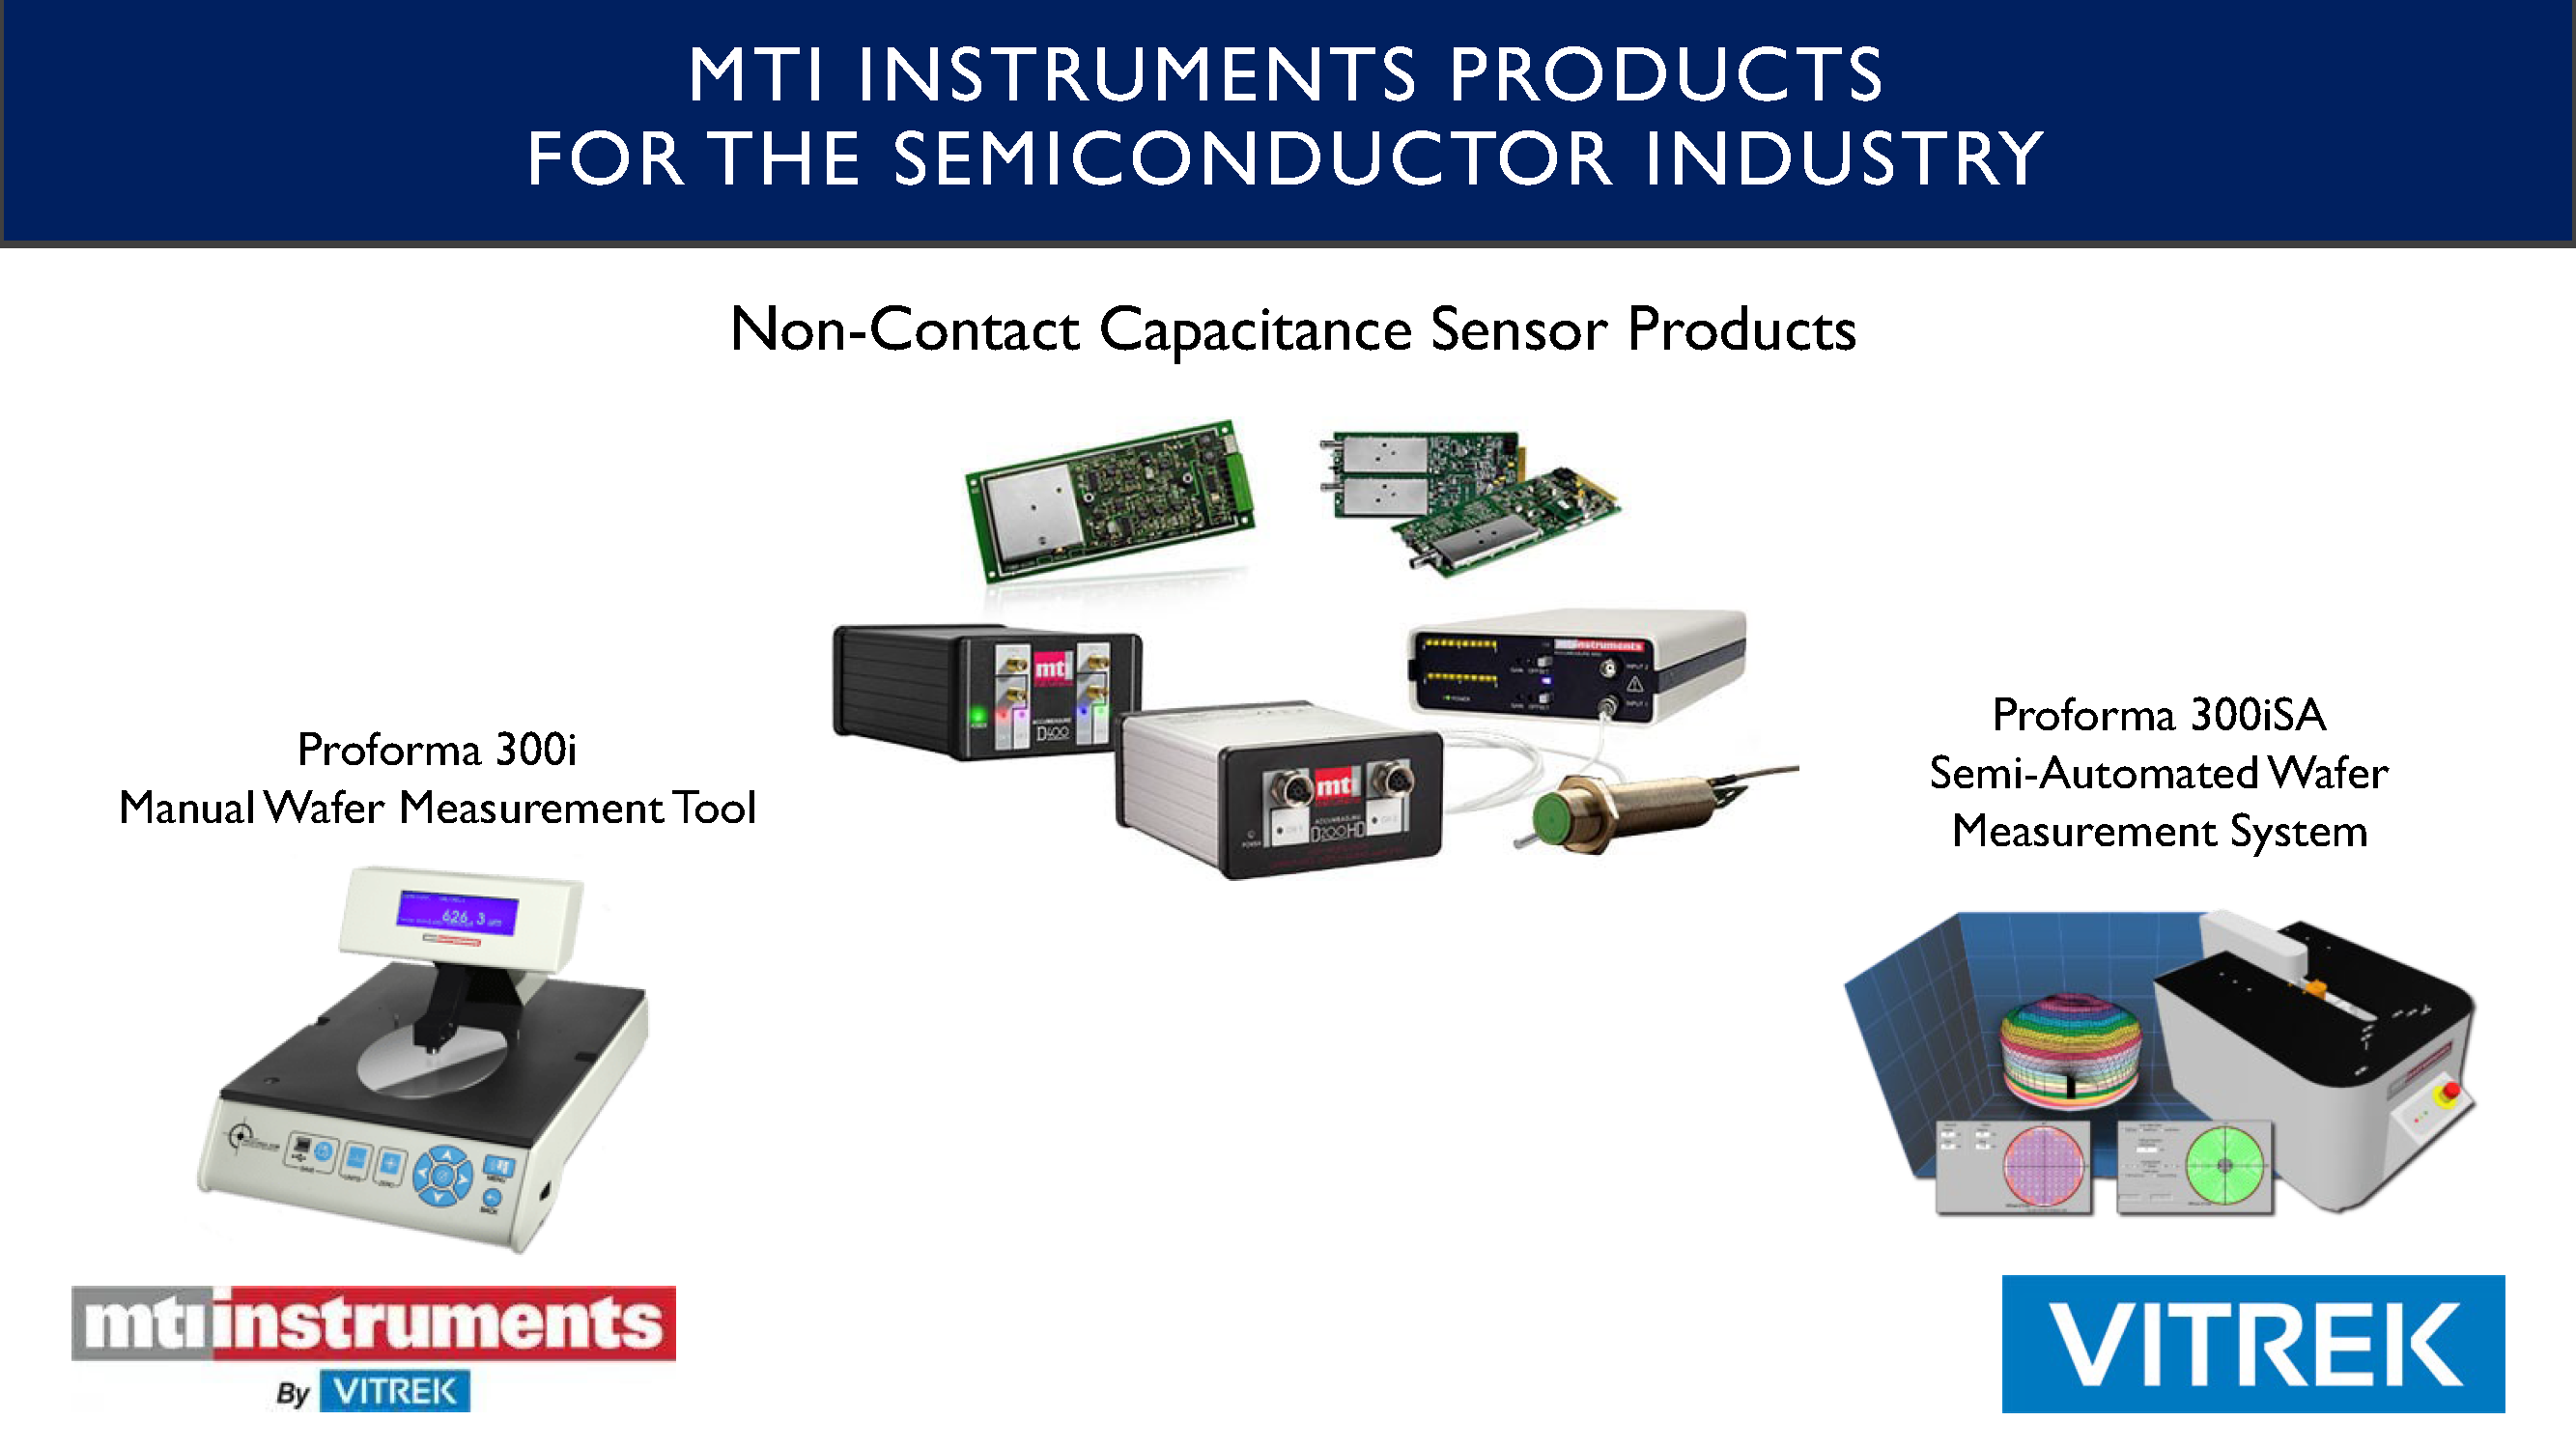
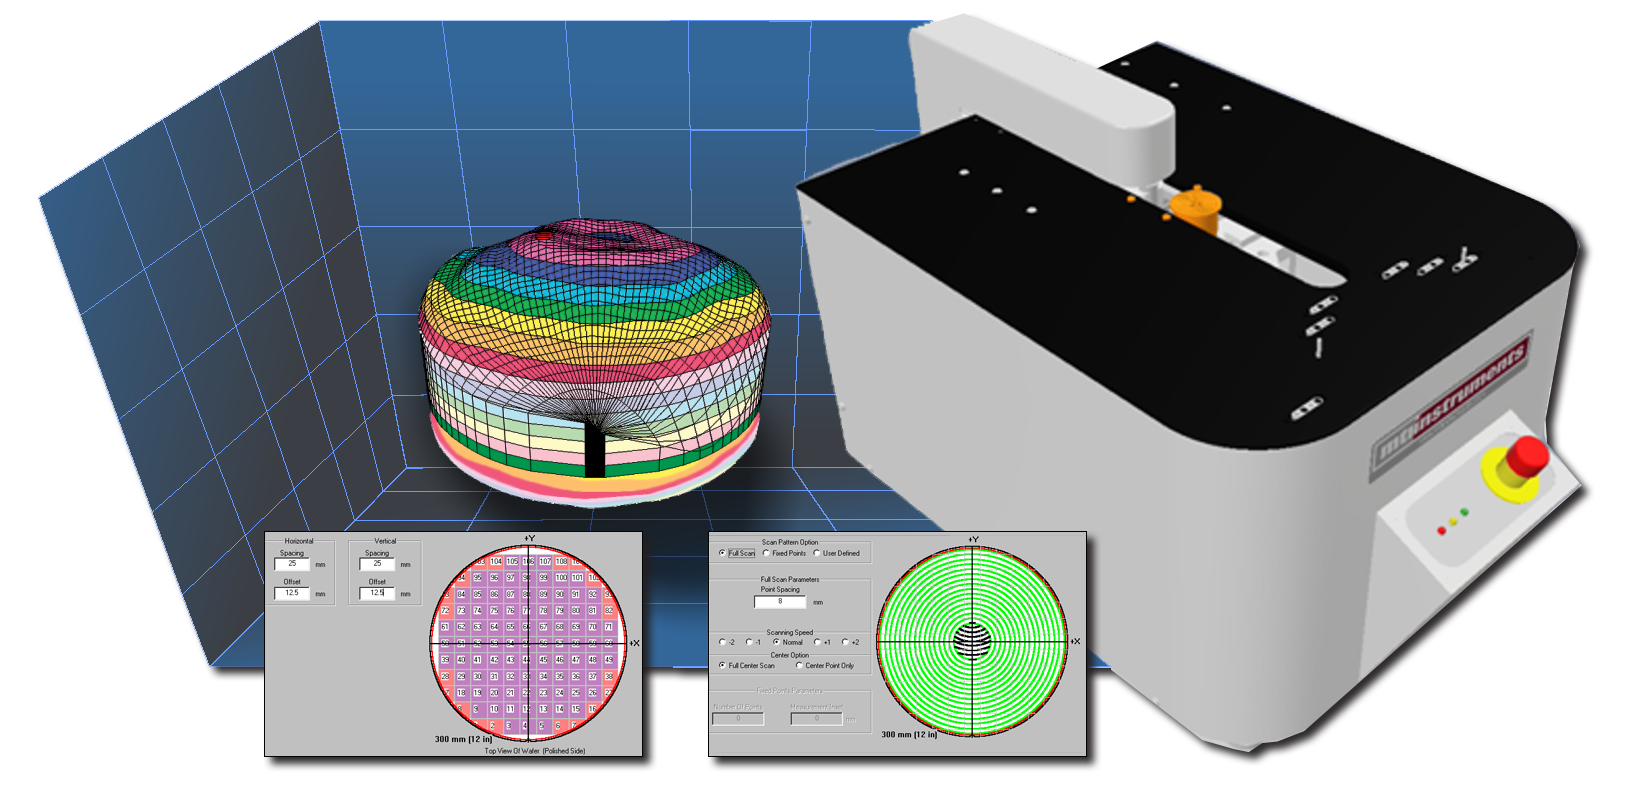
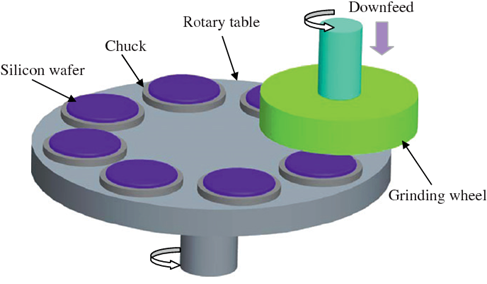
This application note compares MTI’s Accumeasure HD amplifier to SmarAct’s Picoscale interferometer in terms of resolution and accuracy for very small displacement measurements. Specifically, this comparison focuses on minimum expected resolution and the effects of noise on accuracy. High resolution interferometers are widely regarded as the instrument of choice for the type of measurements described in this application note, but MTI’s technology provides exceptional accuracy and stability. Moreover, the Accumeasure is easier to setup and costs significantly less. Micro positioning applications include measuring the mask height of semiconductor wafers during lithography.
Comparisons and Configurations
MTI’s Accumeasure HD amplifier converts a capacitive electric field measurement (displacement) directly into a 24-bit digital reading to measure position, thickness, motion, and vibration. This eliminates errors related to analog filtering, linearization, range extension and the summing of channels to achieve thickness or step measurements.
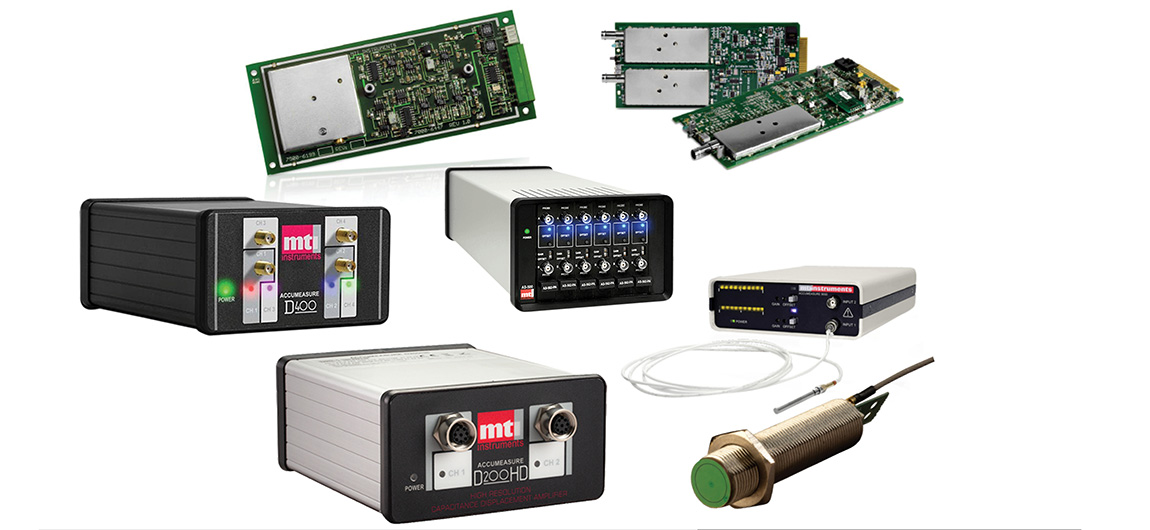
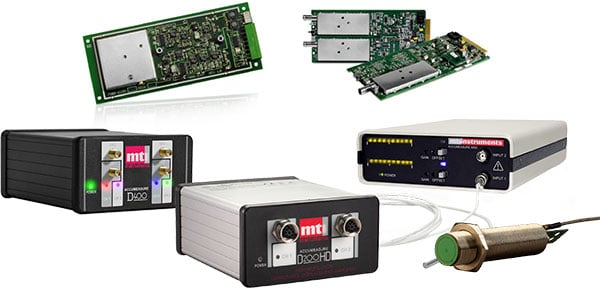
For this experiment, a D200 model amplifier was used with a preamplifier (PA-11) and a standard capacitive probe (ASP-50M-CTA) that has a 50 nanometer (µm) measurement range. The Accumeasure HD is capable of 1 picometer (pm) resolution and can provide sub-nanometer accuracy with select probes.

Fig 1. MTI Accumeasure HD amplifier, preamplifer, and 50 µm range probe.
SmarAct’s PicoScale interferometer is representative of a category of devices, Michelson interferometers, that split a beam from a light source into arms, each of which is reflected back toward the beam splitter. After the amplitudes are combined, the resulting interference pattern that is not directed back toward the light source is directed to a photoelectric detector.
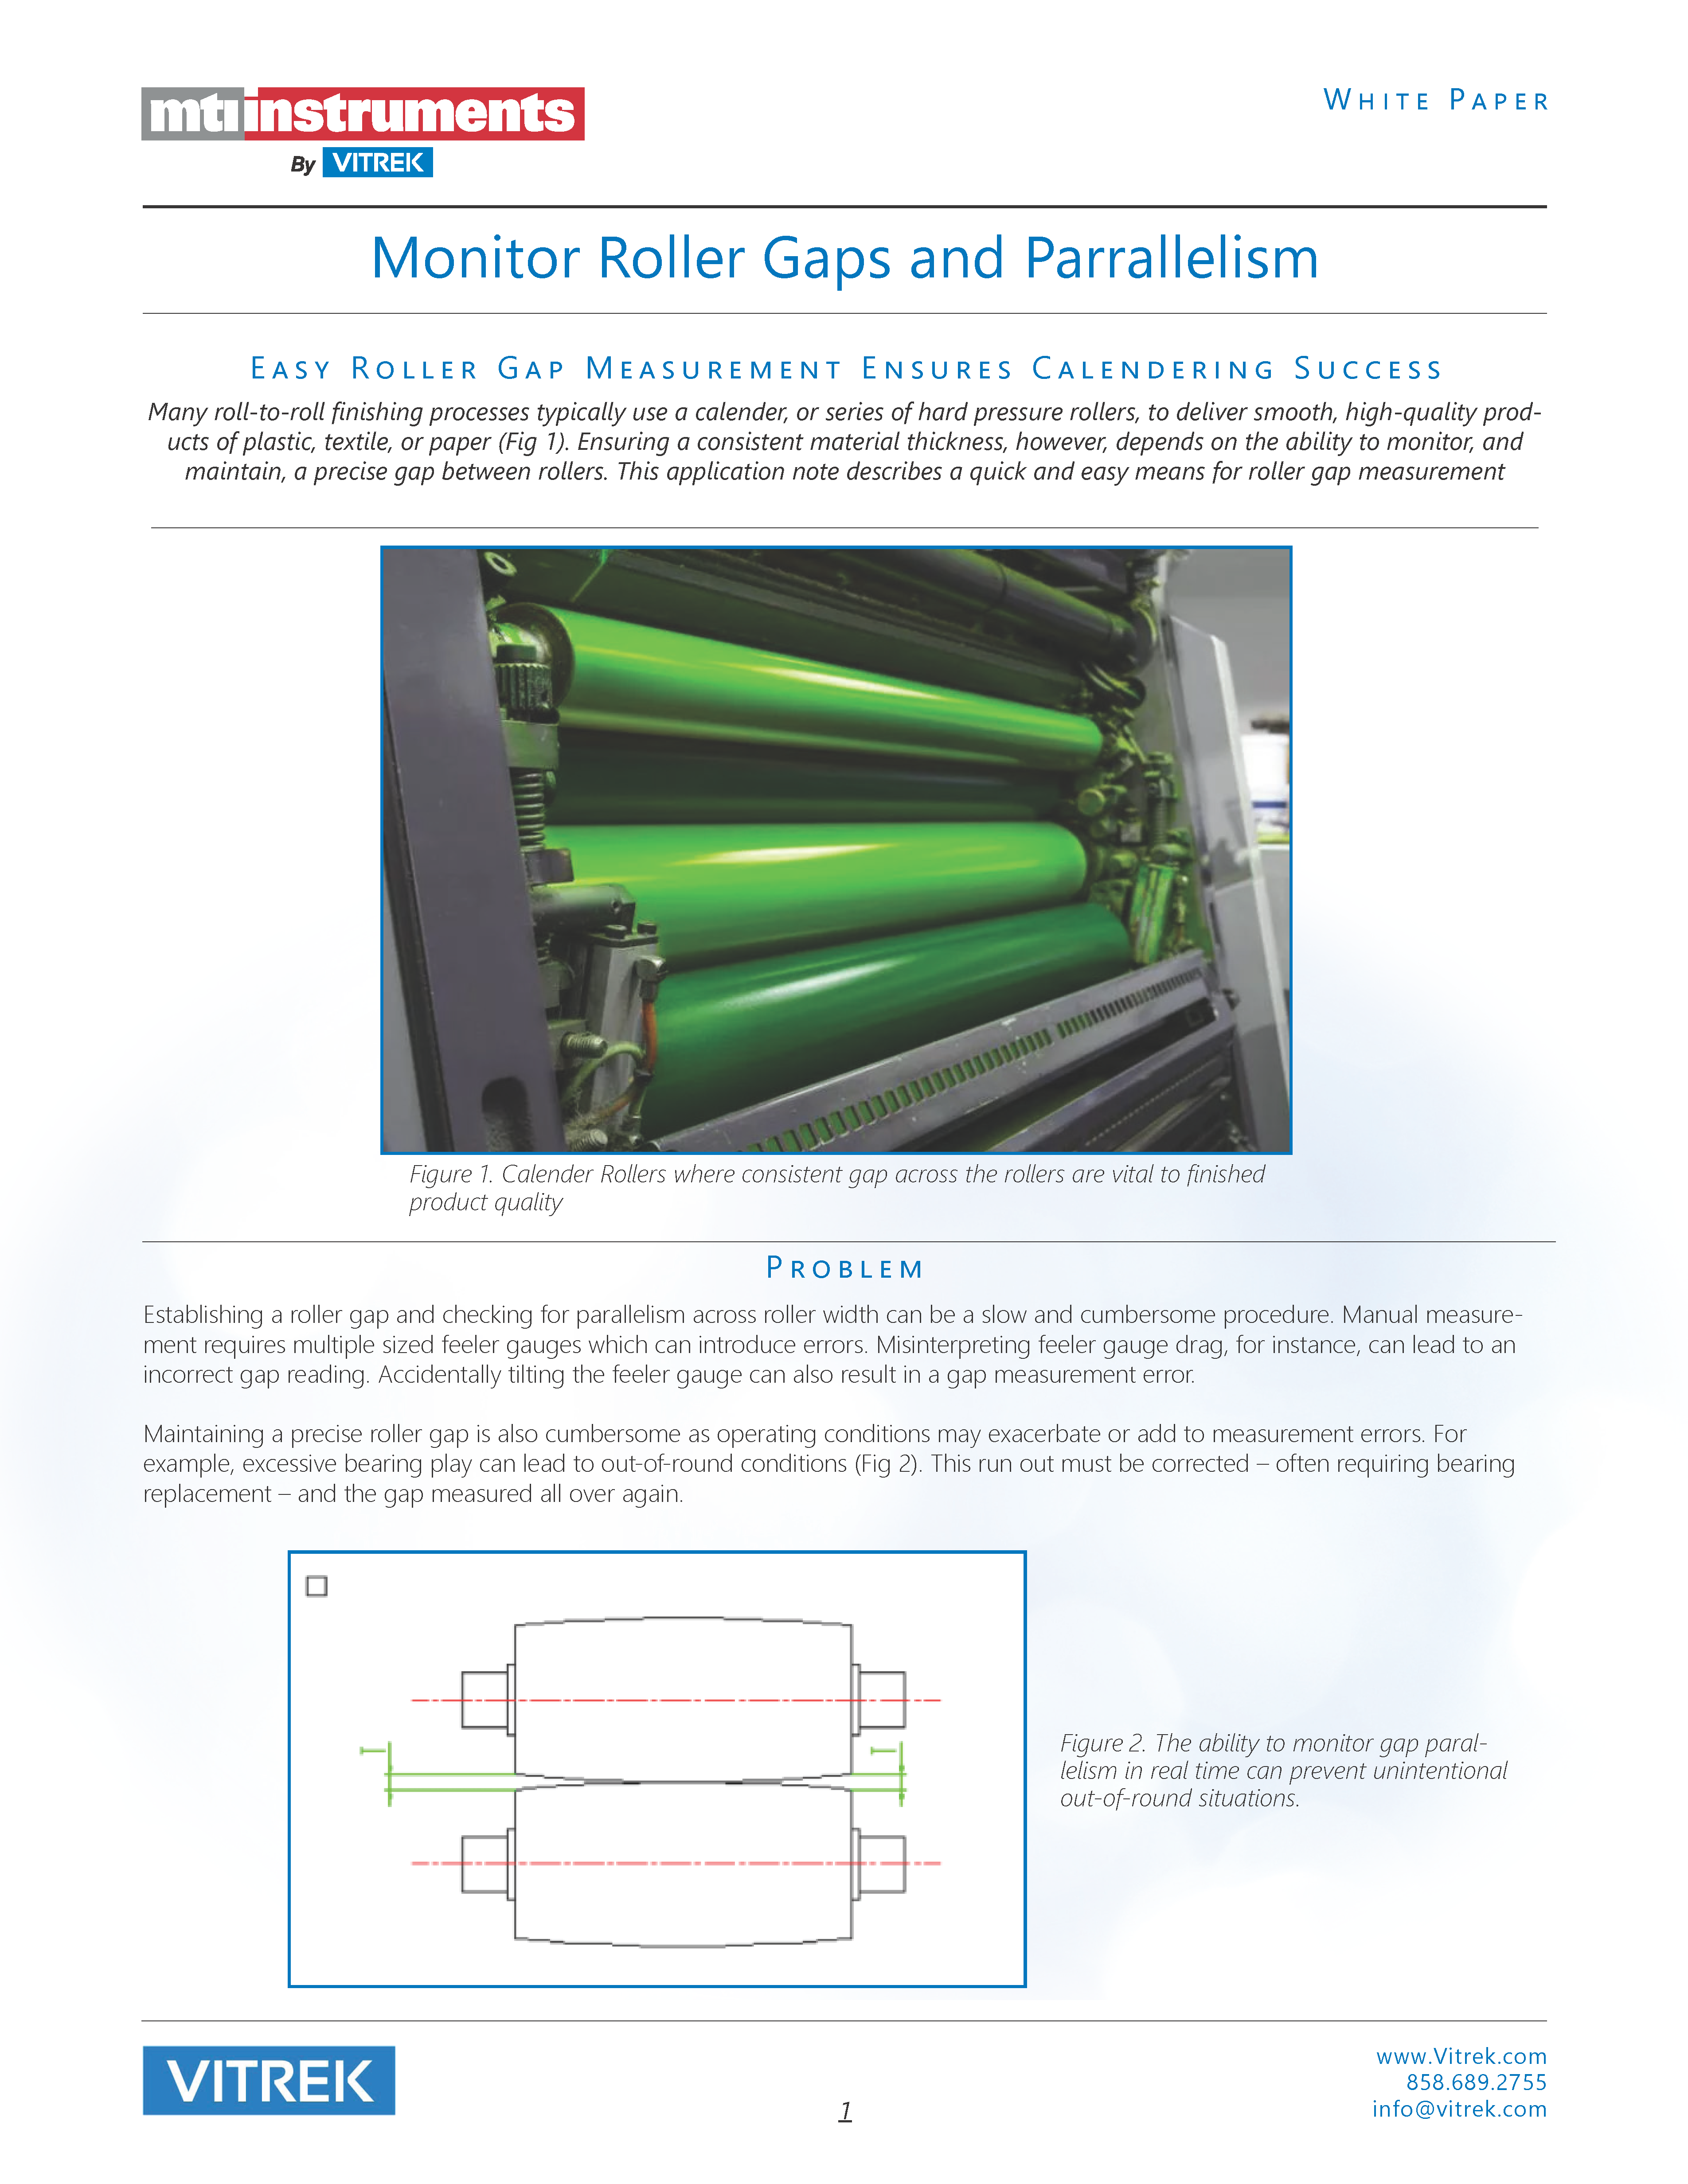
For this experiment, the SmarAct interferometer consisted of the SH-CO2 laser interferometer sensor and the PS-CTRL-V1.4-TAB 3 controller. The SmarAct interferometer has a stated resolution of 70 pm RMS. With peak-to-peak (pk-pk) conversion, this would be 350 pm (using 6X to convert RMS to pk-pk).

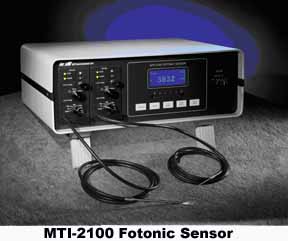
Fig 2. PicoScale controller from SmarAct. The controller contains the laser source and fringe interpolater for making interferometer measurements.

Fig 3. The CO2 interferometer sensor is connected to the controller via-single mode fiber optic cable. It is a Michelson type device.

Fig 4. Basic Michelson interferometer diagram
The Experiment
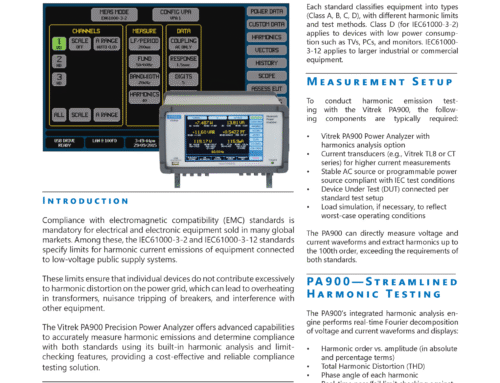
Both the CO2 interferometer sensor and MTI ASP-50M-CTA probe were mounted to a small piezo electric flexure stage. The two sensors did not observe the exact same target but were closed coupled mechanically. The capacitance probe was embedded in the stage for direct observation of piezo flexure motion. The interferometer was mounted on an optical post near the stage and was pointed at a retro reflector mounted atop the stage. In turn, the retro reflector moved with the stage’s motion.
To determine the minimum resolution, measurements were made when the stage was stationary. Measurements were also made with the stage moving back and forth by 12 nm. This enabled observation of the mechanical motion and a comparison of the dynamic results. Both the piezo flexure stage and interferometer were mounted on an isolated air stage to minimize seismic events that could affect the results.
As shown in Figure 5, an Agilent signal generator was used to generate a 10 Hz square wave signal that was sent to a high voltage amplifier. This drove the Piezo System Jena motion stage (100 µm range) back and forth by 12 nm. The system was open loop.

Fig 5. The setup
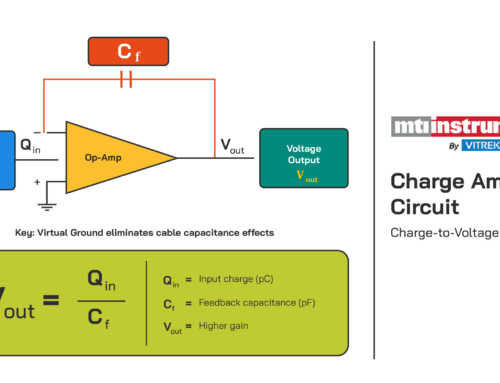
Figure 6 shows the output of the interferometer when the piezo stage was not moving. The interferometer’s baseband noise was 350 Hz and thermal drift was observed. The observation time was limited to less than 2 seconds to minimize the effects of thermal drifts, which are difficult to eliminate. The pk-pk is about 1.4 nm, which is similar to what MTI has observed in other comparisons.

Fig 6. Interferometer base level noise with the target stationary. Note that there is some target mechanical drift due to air currents, and differential thermal stress on the optical supports. If motion due to drift is ignored, the observed pk-pk noise is about 1.4 nm. The specifications for the PicoScale interferometer are 70 pm RMS, which is about 420 pm at best.
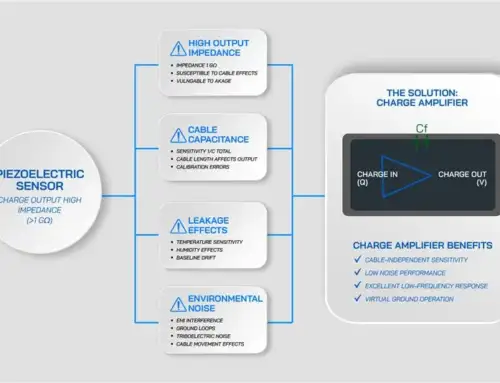
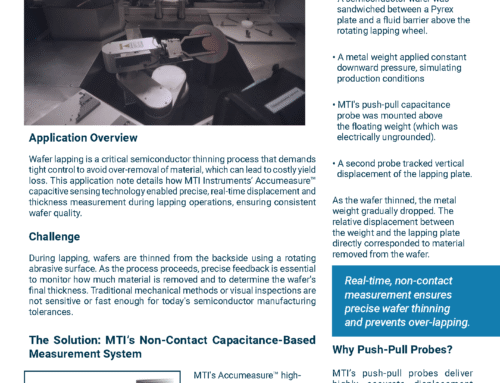
Figure 7 shows the noise output for the Accumeasure HD. The target is stationary at 500 Hz bandwidth.

Fig 7 Digital Accumeasure noise at 500 Hz bandwidth. The target is stationary and pk-pk noise is about 600 pm.

Fig 8. shows pk-pk noise at a 50 Hz bandwidth. The sampling rate was 1 kHz.
At 50 Hz bandwidth, Accumeasure HD noise is about 200 pm pk-pk. The target is stationary. Larger excursions of the signal from mechanical vibrations are caused by micromechanical motion coupled to the isolation table.
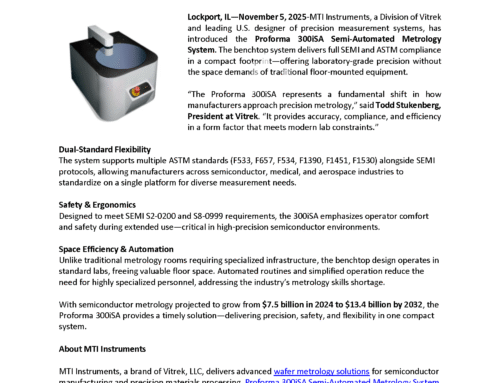
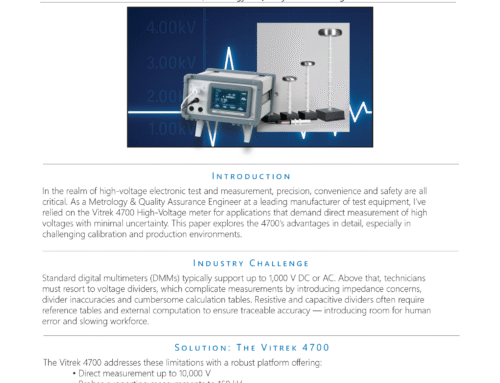
Next, the signal general was turned-on for observation of pk-pk motion. Figure 9 shows the 12 nm open loop dynamic signal at 50 Hz bandwidth. A slight amount of overshoot is observed in the stage.

Fig 9. The Digital Accumeasure measures the stage as it moves back and forth by 12 nm pk-pk.
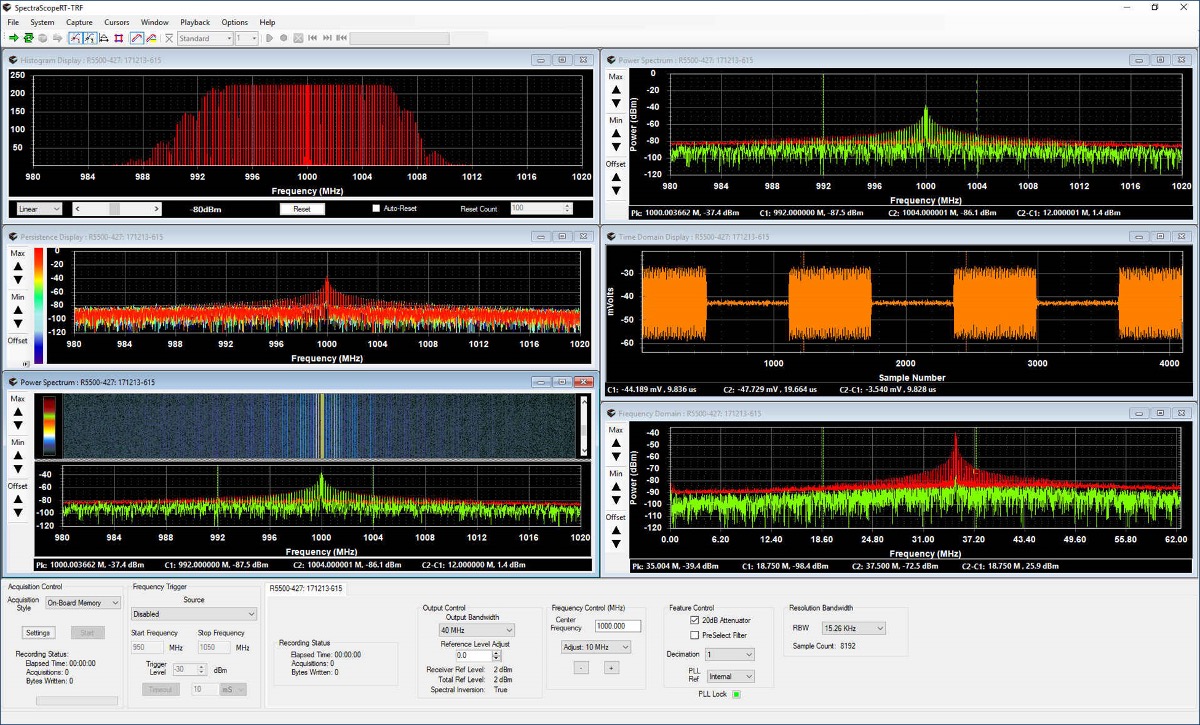
As show in Figure 10, the same motion can be observed using the PicoScale interferometer. Although the noise level on the signal makes it harder to observe the square wave motion seen by MTI’s Digital Accumeasure, the average pk-pk motion is 12 nm, which is the same as with the capacitance sensor. Its also possible that there was some backlash because the retro reflector was mounted atop the stage.

Fig 10. The interferometer signal as seen from the PicoScale user screen. The interferometer¬† measured the piezo electric stage as it moved back and forth by 12 nm pk-pk.¬† This is the same movement and measurement obtained with MTI’s technology. ¬†Note that the peak signals are not level. They are also somewhat noisy because of fringe signal interpolation (noise) and possibly some stage backlash.
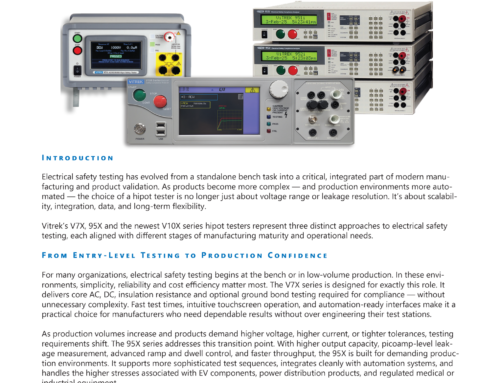
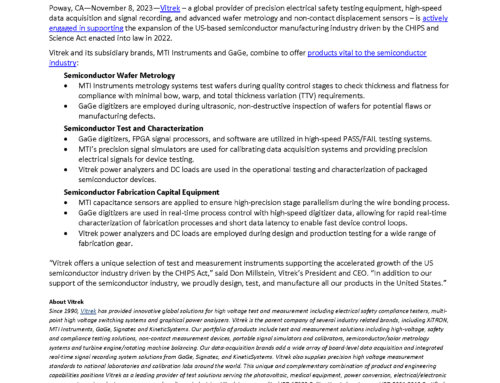
The data below was exported from the MTI Digital Accumeasure and the PicoScale Interferometer and then plotted side-by-side. Both data sets have been offset mathematically for visualization. No additional gain or smoothing has been applied. The interferometer data was bandwidth-limited to 350 Hz.

Fig 11. Comparison of the PicoScale laser interferometer and MTI’s Digital Accumeasure HD. The horizontal scale is seconds and the vertical scale is nanometers.
Conclusion: Accumeasure HD Combines Accuracy with Stability
The MTI Digital Accumeasure demonstrated superior resolution and much greater stability in this piezo flexure stage application. It was very easy to mount the probe against the embedded piezo flexure, thus eliminating unwanted lever arm action. The 200 pm resolution seems to be at the threshold of detectivity, with seismic motion and thermal drift beginning to become the dominant factors in resolution. The HD amplifier was easier to setup than the interferometer and no retroreflector was needed. When set to 100 Hz, the dynamic range of MTI’s Accumeasure HD Amplifier was about 107 dB .


