A blade can remain structurally intact and still present a serious operating risk if its motion is not understood. Turbine blade vibration is a dynamic condition shaped by rotor speed, aerodynamic loading, temperature, clearances, blade geometry, and the changing stiffness of the supporting structure. For engineers responsible for development, acceptance testing, or condition assessment, the objective is not merely to detect motion. It is to measure the right motion, at the right location and bandwidth, with enough confidence to distinguish normal response from a developing failure mechanism.
What Turbine Blade Vibration Reveals
Turbine blades are designed to operate under cyclic stress. Their vibration response is influenced by excitation forces from passing vanes, flow disturbances, imbalance, shaft motion, and transient events such as startup, shutdown, or rapid load changes. A measurable vibration level is therefore not automatically a defect. The engineering question is whether the observed response is consistent with the machine’s expected operating envelope.
The most consequential condition is often resonance. When an excitation frequency approaches a blade natural frequency, even a modest forcing input can produce a substantial increase in displacement and stress. Blade natural frequencies can shift with temperature, centrifugal stiffening, material condition, coating changes, and boundary conditions at the blade root. A mode that appears safely separated from an excitation order in a static analysis may move closer to that order during actual operation.
This is why vibration data must be interpreted against speed, load, temperature, and operating state. A narrow amplitude peak that occurs repeatedly at a specific rotational speed may point to a resonance crossing. A broadband increase may instead indicate flow instability, rubbing, looseness, or changing support dynamics. The waveform, spectrum, phase relationship, and trend over time each provide evidence that simple amplitude alarms can miss.
Common excitation mechanisms
Rotor imbalance typically produces a response at running speed. Misalignment, bent shafts, and mechanical looseness can introduce additional harmonics. In bladed assemblies, aerodynamic excitation commonly appears at engine orders related to the number of stationary vanes, nozzles, or other flow-path features encountered during rotation.
Blade-to-blade variation adds another layer of complexity. Manufacturing tolerances, repair history, coating thickness, local erosion, and root contact conditions can alter individual blade frequencies. In a tuned row, these small differences may spread the response among blades. In some circumstances, mistuning reduces the likelihood of all blades reaching the same peak response; in others, it can concentrate energy in a small number of blades. The implications depend on the blade row, damping, excitation pattern, and allowable stress margin.
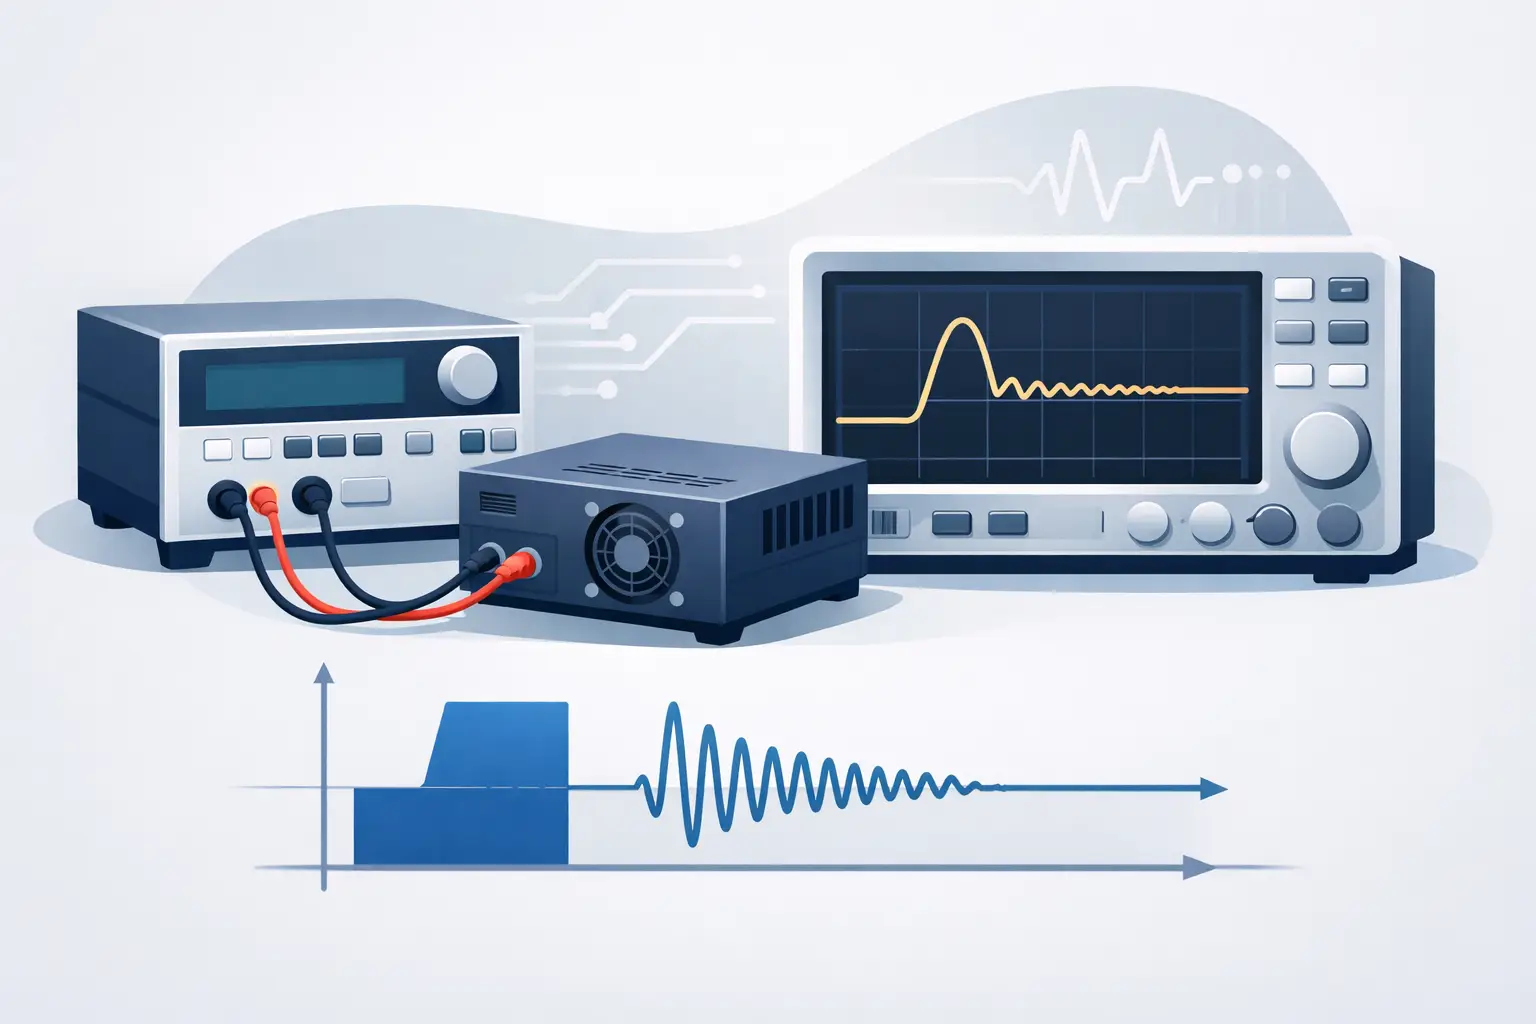
Contact events require special attention. Tip rub, seal interaction, foreign-object damage, or root fretting can create intermittent and nonlinear vibration signatures. These conditions may not behave like a clean sinusoidal resonance. They can generate harmonics, sidebands, transient bursts, or changes in the response during thermal growth. Capturing those features requires adequate sampling performance and synchronized operating data.
Measuring Turbine Blade Vibration Accurately
The measurement method should follow the test objective. Development teams may need high-resolution blade deflection data to validate a finite element model or characterize mode shapes. Production and overhaul teams may prioritize repeatable dimensional checks, runout measurement, and acceptance criteria. Field diagnostic work may focus on changes from a known baseline under controlled operating conditions.
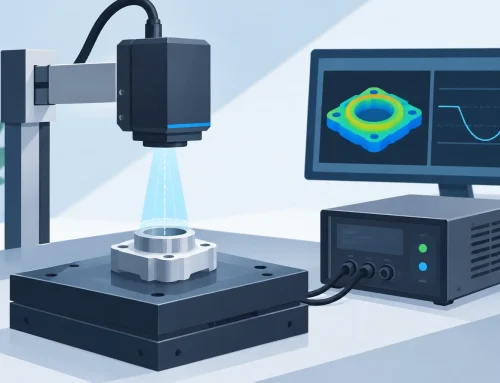
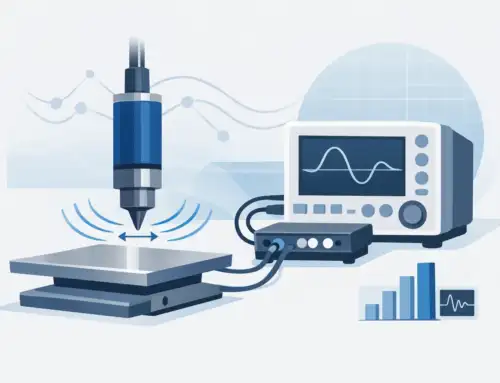
Non-contact displacement measurement is often preferred when blade motion, clearance, or surface condition must be observed without adding mass to the component. Capacitance-based and optical sensor approaches can provide high-resolution measurements, but their suitability differs with target material, surface finish, temperature, standoff range, access, contamination, and required bandwidth. A sensor that performs well on a clean, stationary test article may not deliver the same result in a hot, rotating, or optically challenging environment.
Sensor selection should begin with the expected motion range and frequency content. The system must have sufficient bandwidth to capture the blade response and any relevant harmonics without attenuating or distorting the signal. Its dynamic range must accommodate both baseline motion and the larger excursions expected during resonance crossings or transients. Resolution matters, but it is only one part of measurement quality. Noise performance, linearity, thermal stability, calibration traceability, and mechanical mounting can have equal influence on usable results.
Timing and synchronization determine diagnostic value
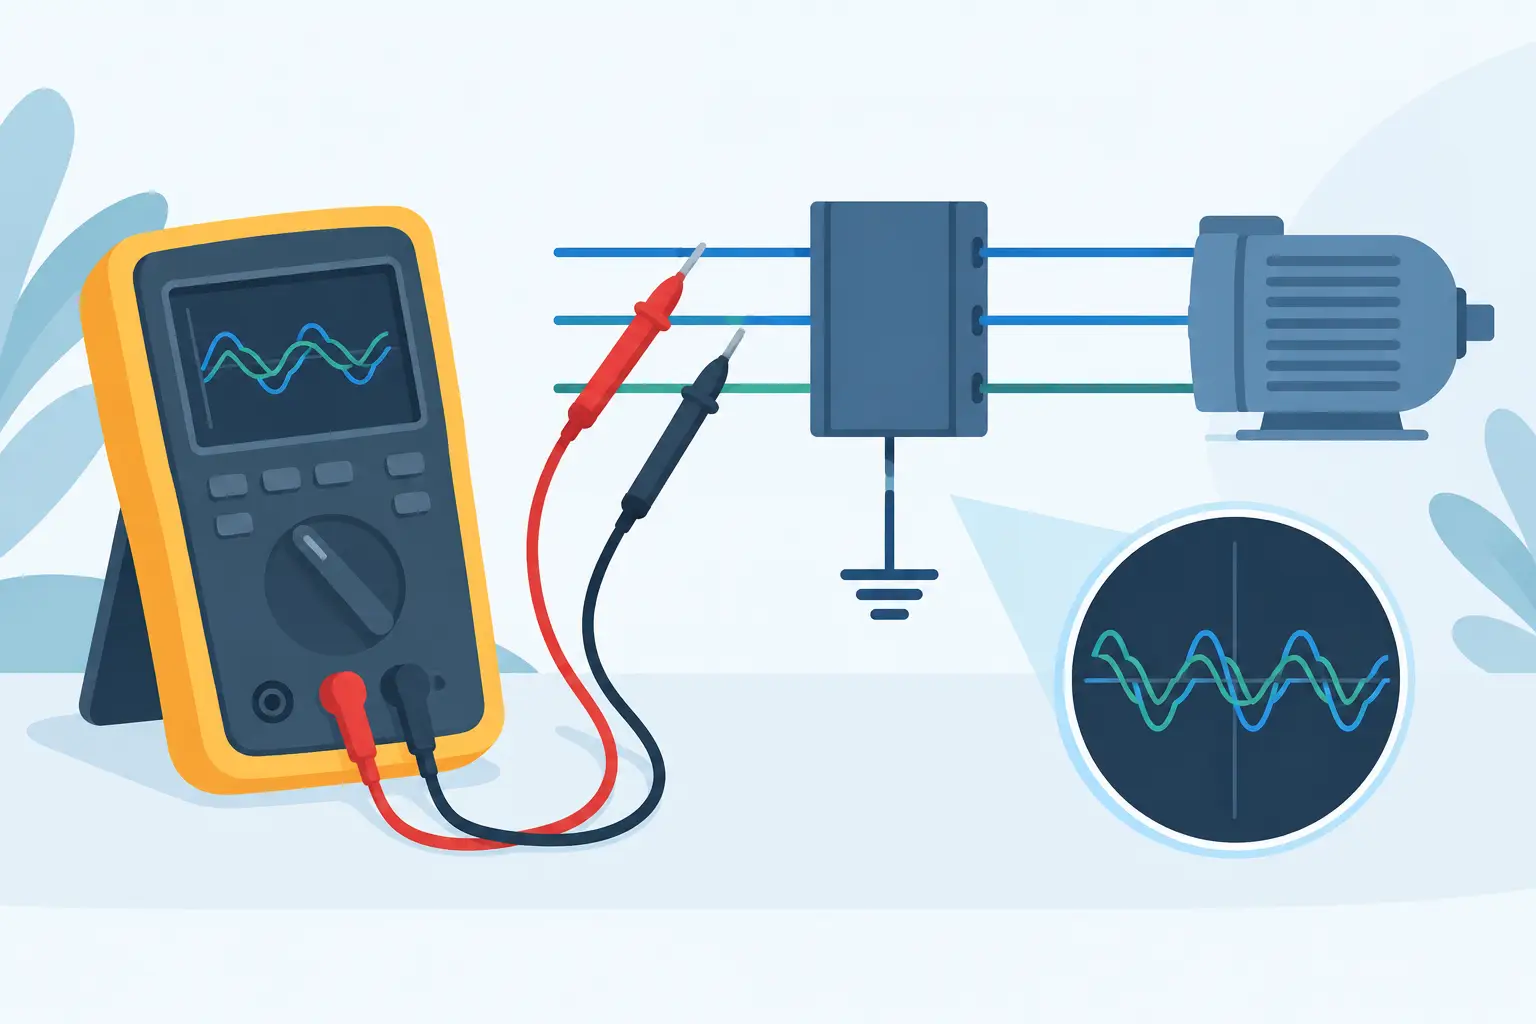
A displacement trace becomes far more useful when it is synchronized to rotational position. A once-per-revolution reference, tachometer, or encoder allows engineers to convert time-domain observations into order-based information. This makes it possible to identify whether a response follows shaft speed, a vane-passing order, a subharmonic condition, or a non-synchronous event.
For multi-channel testing, channel-to-channel timing accuracy is equally significant. Phase comparisons can help separate global rotor behavior from localized blade response, identify nodal behavior, and reveal changes between nominally similar components. If a data acquisition system has uncertain synchronization or inadequate anti-alias filtering, the resulting plots may look plausible while leading to incorrect conclusions.
Data capture must also be planned around the event. A steady-state survey may support long records at moderate sample rates. A rapid acceleration through critical speeds may require higher-speed acquisition, trigger capability, and sufficient pre-trigger recording to capture the onset of a response. Engineers should document the speed ramp, load condition, temperature, sensor position, sensor gap, signal conditioning, and calibration state alongside the measurement record. Those details are essential when results are reviewed months later or compared across test cells.
From Vibration Data to Actionable Decisions
A useful analysis begins with a baseline. Establish vibration signatures for known-good hardware across representative operating points, then define how much variation is expected from normal unit-to-unit differences. This prevents teams from treating every spectral feature as a fault while preserving sensitivity to meaningful deviations.
Frequency spectra and order tracking are central tools, but they should not be viewed in isolation. A peak near a natural frequency does not prove damaging resonance unless its relationship to operating speed, excitation source, damping, and stress is understood. Conversely, a peak that appears modest in displacement may be significant if it occurs at a location with a high stress concentration or if it has increased materially from prior test results.
Trend analysis is particularly valuable for durability testing and recurring inspections. A gradual frequency reduction can indicate a loss of stiffness, cracking, material degradation, or a changing boundary condition. Rising amplitude at an established order may suggest deterioration in balance, alignment, clearances, or aerodynamic uniformity. Abrupt changes warrant immediate review, especially when accompanied by altered phase, unusual transient content, or evidence of contact.
Correlation with analytical models strengthens the result. Experimental modal data can verify whether predicted modes occur where expected and whether modeled boundary conditions represent the assembled hardware. Differences between model and measurement are not necessarily failures of either method. They often reveal assumptions that need refinement, such as support stiffness, contact behavior, temperature effects, or damping estimates.
Building a Defensible Test Plan
A defensible turbine vibration test plan defines the decision before selecting the instrument. Is the purpose to validate a design margin, screen a manufactured part, investigate a field event, or monitor a known risk? Each purpose drives different requirements for sensor type, number of channels, sampling rate, record length, environmental protection, and reporting detail.
The plan should specify measurement locations and justify them against likely mode shapes and access constraints. It should define speed ranges, dwell points, ramp rates, operating loads, and shutdown criteria before testing begins. It should also establish calibration intervals and a documented uncertainty approach. In performance-critical programs, traceable calibration and repeatable setup procedures are part of the measurement system, not administrative extras.
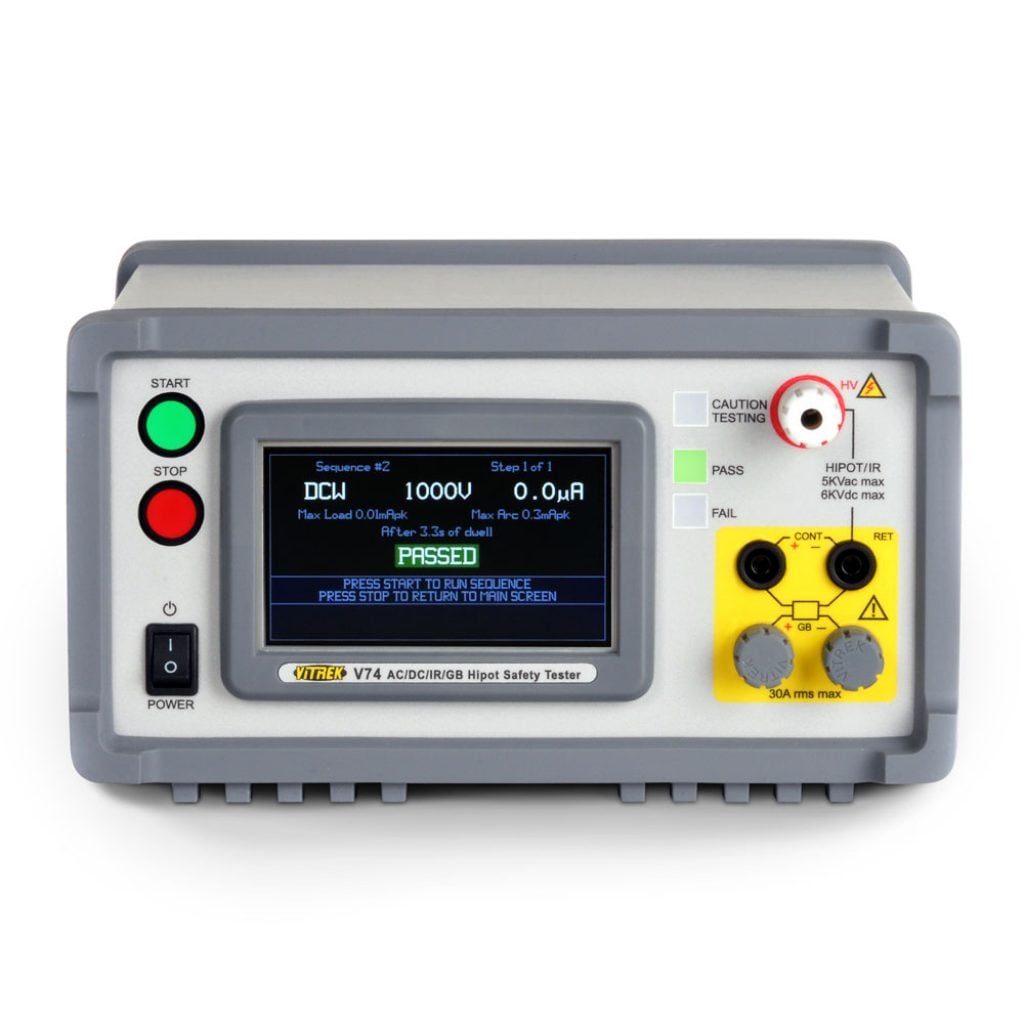
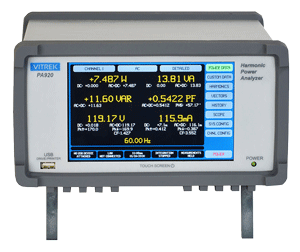
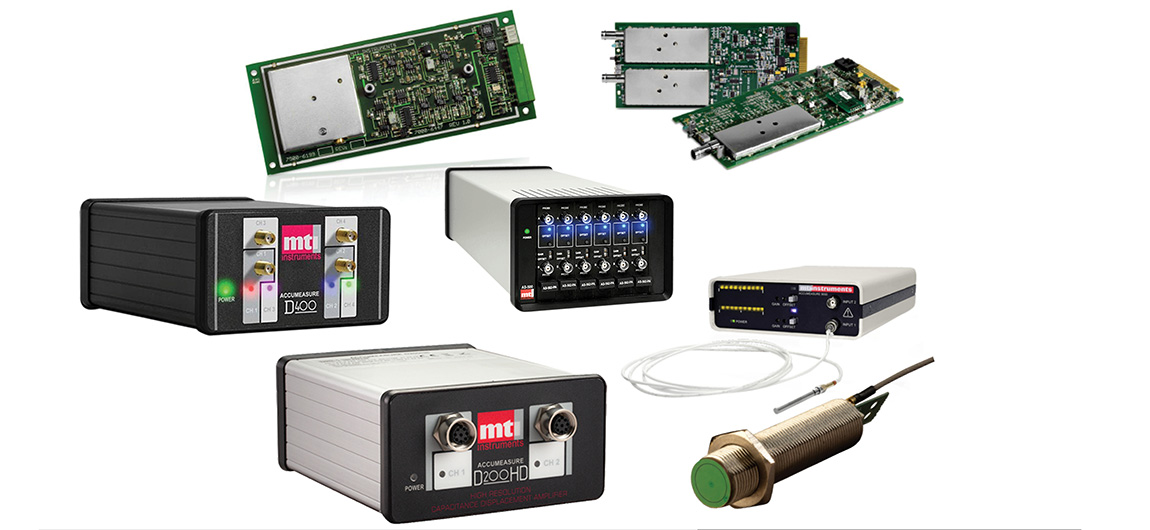
Instrumentation should support the actual test environment rather than an idealized laboratory condition. Cable routing, electromagnetic interference, sensor mounting rigidity, thermal exposure, surface preparation, and grounding can all affect the result. Systems from specialized providers such as Vitrek and MTI Instruments can support high-resolution non-contact measurement workflows where measurement integrity and repeatability are central requirements.
The most valuable turbine blade vibration measurement is the one that gives engineers a credible basis for action: continue testing, adjust the operating envelope, inspect hardware, refine a model, or redesign a component. That confidence comes from disciplined test planning, synchronized data, calibrated instrumentation, and interpretation grounded in the physics of the machine.